This article is brought to you by Datawrapper, a data visualization tool for creating charts, maps, and tables. Learn more.

All Blog Categories

Which fonts to use for your charts and tables

…and how to customize them.
Portrait of Lisa Charlotte Muth
Lisa Charlotte Muth

How should the text appear in your data visualizations? The possibilities are endless: There are millions of typefaces out there (Arial, Times New Roman, Lato, ...) belonging to different categories (serif, sans-serif, condensed, wide, ...). Many of these typefaces come in different fonts (thin, bold, ...). And then they are so many extra ways of adjusting them (uppercase, size, color, ...).

The short answer: When in doubt, set your text in a font that's easy to read. Easy to read is everything that readers are used to. On the web, that means sans-serif, neither overly narrow nor wide, regular (instead of bold or thin) text set in sentence case, in a size that's big enough to read, and in black or almost black. This article explains all these options — and shows how ignoring this advice can set your visualization apart from others.

Choosing a font
01 Use sans-serif typefaces.
02 Use a font with lining and tabular numbers.
03 Use a font with all the symbols you need.
04 Use bold fonts only for emphasis.
05 Avoid very thin fonts.
06 Use neither overly narrow nor overly wide fonts.

Adjusting the font
07 Use text that's big enough.
08 Use a high-contrast color for most text.
09 Use uppercase text sparingly.

Let's start:

Choosing a font

Use sans-serif typefaces.

Serif typefaces (like Times New Roman or Georgia) bring you into a reading flow — that’s why they’re great for setting long texts like novels or newspaper articles. For data visualizations, sans-serif (”without serifs”) typefaces are most often the better choice. They look cleaner and are often easier to skim than serif fonts, especially when it comes to numbers. Our free Datawrapper visualizations, for example, use the sans-serif typeface Roboto. Changing the fonts – including size, placement, color, etc. – in Datawrapper is possible with a custom theme.

Most data visualizations use sans-serif typefaces — like all charts from The Economist and Bloomberg:

<a href="https://www.economist.com/graphic-detail/2022/08/01/a-new-study-shows-how-much-social-capital-matters"><strong>The Economist, 2022</strong></a>. Fonts: <a href="https://design-system.economist.com/foundations/typography/typefaces#econ-sans">Econ Sans and Econ Sans Condensed</a>. The Economist uses different styles from the same commissioned typeface for all text in their visualizations.
The Economist, 2022. Fonts: Econ Sans and Econ Sans Condensed. The Economist uses different styles from the same commissioned typeface for all text in their visualizations.
<a href="https://www.bloomberg.com/news/articles/2022-01-11/confidence-in-faster-global-recovery-in-short-supply-wef-finds?cmpid%3D=socialflow-twitter-graphics" data-type="URL" data-id="https://www.bloomberg.com/news/articles/2022-01-11/confidence-in-faster-global-recovery-in-short-supply-wef-finds?cmpid%3D=socialflow-twitter-graphics"><strong>Bloomberg, 2022</strong></a>. Font: <a href="https://www.linotype.com/6598/neue-haas-grotesk.html">Neue Haas Grotesk</a>. Bloomberg's typeface is based on Helvetica but has a slightly straighter appearance, e.g. in its <strong>R</strong> and <strong>a</strong>.
Bloomberg, 2022. Font: Neue Haas Grotesk. Bloomberg's typeface is based on Helvetica but has a slightly straighter appearance, e.g. in its R and a.

While serif typefaces are rare in data vis, they do exist. Serifs look a bit more classy, traditional, and serious/professional than sans-serifs and can set a visualization apart from others out there. Most often, serifs are only used for visualization headlines:

<strong><a href="https://www.theguardian.com/global-development/2022/jul/21/covid-vaccine-figures-lay-bare-global-inequality-as-global-target-missed">The Guardian, 2022</a></strong>. Fonts: <a href="https://design.theguardian.com/#typography">Guardian Headline and Guardian Text Sans</a>. The Guardian uses the same commissioned serif font for chart titles as they use for article titles.
The Guardian, 2022. Fonts: Guardian Headline and Guardian Text Sans. The Guardian uses the same commissioned serif font for chart titles as they use for article titles.
<strong><a href="https://ourworldindata.org/life-expectancy">Our World in Data, 2019</a></strong>. Fonts: <a href="https://fonts.google.com/specimen/Playfair+Display">Playfair Display</a> and <a href="https://fonts.google.com/specimen/Lato">Lato</a>. "Display" means the font is only suitable at large sizes, like in titles. (The font name doesn't seem to be an homage to data vis pioneer <a href="https://en.wikipedia.org/wiki/William_Playfair">William Playfair</a>.)
Our World in Data, 2019. Fonts: Playfair Display and Lato. "Display" means the font is only suitable at large sizes, like in titles. (The font name doesn't seem to be an homage to data vis pioneer William Playfair.)
<a href="https://www.washingtonpost.com/world/interactive/2022/biden-ukraine-military-aid-us/"><strong>The Washington Post, 2022</strong></a>. Fonts: <a href="https://www.washingtonpost.com/archive/1998/02/11/a-new-face-type/0f0b93fe-42c0-4667-bfeb-d32229fabf82/">Postoni</a> and Franklin. Like Playfair, Postoni is a Display font: It has a high contrast of thick and thin strokes (just look at that "U" in "Ukraine") and should therefore only be used at large sizes, like here.
The Washington Post, 2022. Fonts: Postoni and Franklin. Like Playfair, Postoni is a Display font: It has a high contrast of thick and thin strokes (just look at that "U" in "Ukraine") and should therefore only be used at large sizes, like here.
<a href="https://www.pewresearch.org/politics/2022/06/16/politics-on-twitter-one-third-of-tweets-from-u-s-adults-are-political/"><strong>Pew Research, 2022</strong></a>. Fonts: <a href="https://en.wikipedia.org/wiki/Georgia_(typeface)">Georgia</a> Italic and <a href="https://en.wikipedia.org/wiki/Franklin_Gothic">Franklin Gothic</a>. Unusual: Pew Research uses sans-serifs everywhere except in the description.
Pew Research, 2022. Fonts: Georgia Italic and Franklin Gothic. Unusual: Pew Research uses sans-serifs everywhere except in the description.

But some data vis designers use serifs for labels and numbers, too:

<a href="https://www.behance.net/gallery/148418917/The-deepest-lakes"><strong>Federica Fragapane, 2022</strong></a>. Most of Federica's data visualizations use serif fonts. They help set an almost "map-explorative" and literary vibe.
Federica Fragapane, 2022. Most of Federica's data visualizations use serif fonts. They help set an almost "map-explorative" and literary vibe.
<strong><a href="https://www.theguardian.com/us-news/ng-interactive/2018/oct/14/donald-trump-zero-tolerance-policy-special-investigation-immigrant-journeys">The Guardian, 2018</a></strong>. Fonts: <a href="https://design.theguardian.com/#typography">Guardian Text Egyptian and Guardian Figures</a>. One of the rare news projects that uses a serif typeface for all labels and numbers.
The Guardian, 2018. Fonts: Guardian Text Egyptian and Guardian Figures. One of the rare news projects that uses a serif typeface for all labels and numbers.

If you browse a font catalog like MyFonts, Adobe Fonts, or Google Fonts, you'll notice more categories than just serif and sans-serif: They also let you choose slab serifs, script fonts, handwritten-looking fonts, and monospace fonts. They're all rarely used in data visualization — but here are a few examples:

<a href="https://www.spiegel.de/wissenschaft/natur/klimwandel-in-deutschland-aussergewoehnlich-warm-oder-schon-normal-a-ea8f6054-0d75-4dd6-ab7e-bbc0410ded27"><strong>SPIEGEL, 2022</strong></a>. Fonts: <a href="https://www.lucasfonts.com/gallery/books-newspapers/spiegelslab-2019">SPIEGEL Slab</a> and <a href="https://www.lucasfonts.com/fonts/spiegel-sans/info">SPIEGEL Sans</a>. <strong>Slab serifs</strong> have serifs that are thicker and more emphasized than those of normal serif typefaces.
SPIEGEL, 2022. Fonts: SPIEGEL Slab and SPIEGEL Sans. Slab serifs have serifs that are thicker and more emphasized than those of normal serif typefaces.
<a href="https://pudding.cool/2020/07/gendered-descriptions/"><strong>The Pudding, 2020</strong></a>. Font: <a href="https://fonts.google.com/specimen/Walter+Turncoat">Walter Turncoat</a>. <strong>Handwritten</strong> fonts are most often encountered in comics. They give a playful, fictional vibe.
The Pudding, 2020. Font: Walter Turncoat. Handwritten fonts are most often encountered in comics. They give a playful, fictional vibe.
<strong><a href="https://www.nbcnews.com/news/world/ukrainians-left-country-escape-war-russia-are-coming-back-rcna35441">NBC News, 2022</a></strong>. Font: <a href="https://klim.co.nz/retail-fonts/founders-grotesk-mono/">Founders Grotesk Mono</a>. <strong>Monospace</strong> fonts give each letter the same width, and hence have a typewriter look and feel.
NBC News, 2022. Font: Founders Grotesk Mono. Monospace fonts give each letter the same width, and hence have a typewriter look and feel.
<a href="https://densitydesign.github.io/teaching-dd14/es02/group04/question02"><strong>Density Design, 2019</strong></a>. Font: <a href="https://fonts.google.com/specimen/Roboto+Mono">Roboto Mono</a>. Another data vis project that uses a <strong>monospace.</strong>
Density Design, 2019. Font: Roboto Mono. Another data vis project that uses a monospace.

When in doubt, use a sans-serif typeface for the text in your visualization. Roboto, Lato, Open Sans, Source Sans Pro, and Noto Sans are all good options and free to use. None of them will make your visualization stand out, but all of them will be readable and pleasant to look at.

If your organization uses a lot of serif text, consider using that same serif typeface for the title of your visualizations to make them more recognizable.

👉 Read more: Choosing Fonts for Your Data Visualization by Tiffany France

Use a font with lining and tabular numbers.

Different fonts have different ways to display numbers. There are two distinctions: First, between so-called oldstyle figures and lining figures. Lining numbers "line up": They're all the same height. Oldstyle numbers go below and above the "line." They're common in serif typefaces like Georgia and beautiful to look at in a paragraph, but hard to read in a table, tooltip, or as an axis tick. For your data visualizations, use fonts with lining figures.

The second distinction is between proportional and tabular figures:

Tabular figures are, as the name implies, great for tables. That's because every number is the same width. It's easy to see instantly how many figures a number has, because a 124.17 will be the same length as a 680.90, but shorter than a 1,111.17.

So why do proportional figures exist at all, you ask? It's because they're nicer to look at in a paragraph than tabular figures. An 8 deserves more width in text than a 1, just like a W deserves more space than a J. But for most of your data visualizations, use tabular figures.

As in the examples above, oldstyle figures are almost always proportional and tabular figures are always lining figures. All the sans-serif typefaces I mentioned (Roboto, Lato, Open Sans, Source Sans Pro, and Noto Sans) come with tabular, lining figures. You can also use font catalogs like Adobe Fonts to filter by "default figure style."

👉 Read more: Finding the best free fonts for numbers by Samantha Zhang
👉 Read more: Fonts for Complex Data by Jonathan Hoefler

Do you create a lot of tables and want to go one step further? Then consider fonts with tabular, lining figures that are multiplexed (also called duplexed or uni-width). Multiplexed means that each character and figure uses the same width in each font weight. Bold text set in most fonts is wider than the same text in a regular font style. Multiplexed fonts don't have that quirk, which makes them great to highlight numbers in tables:

To play around with a multiplexed font, you can download and try out Recursive from Google Fonts. For more multiplexed fonts, visit the article Uniwidth typefaces for interface design by Lisa Staudinger.

Use a font with all the symbols you need.

Besides the figure style, the font you choose should also have all the characters (typographers call them glyphs) you need. Do you need special characters for specific languages (ü ß é)? Are you using lots of currency symbols ($ € £ ¥)? How about math symbols (+ ÷ × = %)? ® and ©? Reference marks (* † ‡) or superscripts for footnotes (¹ ² ³)? Confirm they all exist before you adjust your whole visualization to a font.

All these glyphs need to be drawn by a type designer — often by hand — so don't take for granted that they come with every cheap font. For example, superscript numbers (¹ ² ³) are not simply smaller numbers. Good type designers draw a ² so that it's more legible than a simply size-reduced 2.

Don't just check that all needed glyphs exist, but also that you like how they look. Do the % signs in the Source Code and Recursive fonts make you happy, or are they too experimental for your needs?

👉 Read more: Checklist for choosing data viz typefaces by Diana MacDonald

Use bold fonts only for emphasis.

Most typefaces come with fonts for different weights, like thin, light, regular (= the default, also called normal), medium (= a slightly bolder regular), bold, and black (= extra bold). Webfonts often use numbers for these weights, where 400 is regular and 700 is bold.

Bold or even “black” text feels more self-confident and attention-grabbing than regular font weights. But for the slightly longer text in your visualizations (like descriptions, notes, or annotations) the regular or medium font weights are often the easiest to read. Use bold text only for titles or to emphasize a few words in annotations.

Here are two examples, both by The Washington Post:

<a href="https://www.washingtonpost.com/business/2022/06/16/mortgages-interest-rate-hike/"><strong>The Washington Post, 2022</strong></a>. Font: <a href="https://www.myfonts.com/collections/franklin-font-itc">ITC Franklin Pro</a> in regular (400) and bold (700). Note that the most important numbers are set in bold and black, while less important values are in regular and gray.
The Washington Post, 2022. Font: ITC Franklin Pro in regular (400) and bold (700). Note that the most important numbers are set in bold and black, while less important values are in regular and gray.
<a href="https://www.washingtonpost.com/business/2022/06/20/gas-prices-by-state-explained/"><strong>The Washington Post, 2022</strong></a>. Fonts: Franklin (as above) and Georgia ("Gulf of Mexico"). The longer text to the left is set in a bigger size, but "Port Arthur, Texas" is what readers will notice first, thanks to its boldness.
The Washington Post, 2022. Fonts: Franklin (as above) and Georgia ("Gulf of Mexico"). The longer text to the left is set in a bigger size, but "Port Arthur, Texas" is what readers will notice first, thanks to its boldness.

Don't use very thin fonts.

Text set in a thin or light font weight has such delicate strokes that it looks as if it's set in a brighter color (e.g. gray instead of black). If you're trying to make text look less important while getting around a restrictive color contrast ratio, thinner weights might sound like a great solution.

But as you can see in the example above, thin font weights are also really, really hard to read. Only use them in a high-contrast color and in big sizes (often, that means for titles only).

👉 Read more: Do’s and Don’ts of Using Light Typefaces by Anthony Tseng

Use neither overly narrow nor overly wide fonts.

Narrow (also called condensed) fonts need less space, so it’s tempting to use them in a data visualization. The problem: The less space a character gets, the harder it is to read. Narrow fonts are more difficult to decipher than normal-width fonts. Very wide fonts like Montserrat have the opposite problem: They’re easy to read but use too much space.

Most newsrooms use normal-width fonts. I can only think of two that diverge from that norm, NPR and The Wall Street Journal:

<a href="https://www.npr.org/2022/03/10/1084897499/nurses-are-waiting-months-for-licenses-as-hospital-staffing-shortages-spread?t=1660054640024"><strong>NPR, 2022</strong></a>. Fonts: <a href="https://www.typography.com/fonts/gotham/styles/screensmart">Gotham</a>, <a href="https://www.typography.com/fonts/knockout/styles">Knockout</a>, and <a href="https://en.wikipedia.org/wiki/Helvetica">Helvetica</a>. The wide Gotham is only used for the title of this visualization.
NPR, 2022. Fonts: Gotham, Knockout, and Helvetica. The wide Gotham is only used for the title of this visualization.
<strong><a href="https://www.wsj.com/articles/is-it-better-to-rent-or-buy-what-to-do-in-a-hot-housing-market-11652312186">Wall Street Journal, 2022</a></strong>. Fonts: <a href="https://frerejones.com/families/retina">Retina</a> and <a href="https://frerejones.com/families/retina">Retina Narrow</a>. The Journal uses the normal-width Retina in most charts but falls back to the narrow version when they feel it's needed.
Wall Street Journal, 2022. Fonts: Retina and Retina Narrow. The Journal uses the normal-width Retina in most charts but falls back to the narrow version when they feel it's needed.

It's hard to use narrow typefaces elegantly. They quickly look like a slightly retro, cramped compromise that communicates, "We wanted to remain a certain font size but couldn't make the design work for a normal-width font." But often, normal-width text in a smaller size is as or even more readable than bigger text in a narrow typeface:

But there are beautiful examples too. The 2007 Feltron report uses an extremely narrow typeface and makes it work by setting only really big text:

<strong><a href="http://feltron.com/FAR07.html">Nicholas Felton, 2007</a></strong>. Font: <a href="https://www.myfonts.com/products/pro-light-ult-cond-univers-368563">Univers 49 Light Ultra Condensed</a>.
Nicholas Felton, 2007. Font: Univers 49 Light Ultra Condensed.

👉 Read more: Condensed fonts: The good, the bad, the ugly by Carrie Cousins

Adjusting the font

Use a font size that's big enough.

So far, we covered which typefaces and fonts we should choose for our data visualizations. Let's now talk about how and when we can customize them by making them bigger or smaller, giving them a higher- or lower-contrast color, and making them uppercase. First, the font size:

The Web Content Accessibility Guidelines (WCAG) have a lot of opinions on how to make the web more accessible and readable. It's likely that your organization tries to comply with these guidelines. So what do they advise your minimum font size to be? Turns out, they don't give a clear answer. That's because the readability of a typeface depends not just on font size, but also on font family, capitalization, letter spacing, and text color:

Text annotations in Datawrapper use a default 14px for Roboto. Depending on the font family, everything below 12px will likely be too small. If you're not sure, ask a friend or coworker to help you make the decision.

👉 Read more: Accessible Font Sizing, Explained by Andrés Galante

Use a high-contrast color for most text.

While the WCAG can't give us a minimum font size, they do mention a minimum contrast ratio. Use a contrast checker to make sure your colors comply. For more explanations and a more critical view on the topic, read our article It’s time for a more sophisticated color contrast check for data visualizations.

Use uppercase text sparingly.

Uppercase ("all caps") text is harder to read than "sentence case" text that has both uppercase and lowercase letters. That’s because the shapes of letters help people to recognize words – and in uppercase, the whole text looks like a rectangle. That said, uppercase text can look tidier precisely because of the missing up and downs.

As soon as you transform your text to uppercase, you’ll find that the text becomes wider than it was in normal sentence case — while also looking a bit dense:

But there are a few tricks to adjust that:

  • Space out the letters a bit more. Typographers often call that “tracking”, while web designers call it letter-spacing.
  • Decrease the font size to make it shorter.
  • Now make the text bolder to give it the same letter stroke width as your original text.

Here's the full process:

The result is an uppercase text that's similar in length and letter stroke width to the lowercase version:

If you want to use uppercase text in your data visualization, limit it to just a few words. Because uppercase words look so important and neat, they communicate: "I'm not like the other elements here." Often they're used for labels or headlines, e.g. filter elements, (a few) category labels in tooltips, group labels, axis labels, or header text in tables:

<a href="https://www.lefigaro.fr/elections/legislatives/resultats-legislatives-2022-qui-gagne-et-qui-perd-des-sieges-dans-la-nouvelle-assemblee-20220619"><strong>Le Figaro, 2022</strong></a>. Font: <a href="https://fonts.google.com/specimen/Source+Sans+Pro">Source Sans Pro</a>. Uppercase is often used for <strong>filter elements</strong> in data visualizations, like these buttons.
Le Figaro, 2022. Font: Source Sans Pro. Uppercase is often used for filter elements in data visualizations, like these buttons.
<a href="https://graphics.reuters.com/USA-ELECTION/VIRGINIA/gkplgdmzavb/index.html"><strong>Reuters, 2021</strong></a>. Font: <a href="https://fonts.google.com/specimen/Source+Sans+Pro">Source Sans Pro</a>. The uppercase <strong>category labels</strong> "Votes" and "Pct." look tidy and lose importance by being smaller and grayer than the other text in the tooltip.
Reuters, 2021. Font: Source Sans Pro. The uppercase category labels "Votes" and "Pct." look tidy and lose importance by being smaller and grayer than the other text in the tooltip.
<a href="https://www.nytimes.com/interactive/2021/us/covid-cases.html?name=styln-coronavirus%C2%AEion=TOP_BANNER&amp;block=storyline_menu_recirc&amp;action=click&amp;pgtype=Article&amp;variant=show&amp;is_new=false"><strong>The New York Times, 2021</strong></a>. Font: NYT Franklin (an adjusted Franklin). These uppercase <strong>category labels </strong>are set in the same color but way smaller than the other text elements.
The New York Times, 2021. Font: NYT Franklin (an adjusted Franklin). These uppercase category labels are set in the same color but way smaller than the other text elements.
<a href="https://www.nytimes.com/2022/05/31/health/omicron-deaths-age-65-elderly.html?smtyp=cur"><strong>The New York Times, 2022</strong></a>. Font: NYT Franklin. Because uppercase text looks so different from other kinds of text, it's easy to find —&nbsp;and hence ideal for <strong>group labels.</strong>
The New York Times, 2022. Font: NYT Franklin. Because uppercase text looks so different from other kinds of text, it's easy to find — and hence ideal for group labels.
<a href="https://www.washingtonpost.com/business/2022/06/16/mortgages-interest-rate-hike/"><strong>The Washington Post, 2022</strong></a>. Font: Franklin. Similar to group labels, <strong>header tables </strong>can work well in uppercase (if the text is not too long).
The Washington Post, 2022. Font: Franklin. Similar to group labels, header tables can work well in uppercase (if the text is not too long).
<strong><a href="https://www.politico.com/news/2021/10/07/biden-vaccine-mandate-counties-515337">Politico, 2021</a></strong>. Font: <a href="https://fonts.adobe.com/fonts/din-2014">DIN 2014</a>. The <strong>axis labels</strong> are set in uppercase to set them apart from annotations.
Politico, 2021. Font: DIN 2014. The axis labels are set in uppercase to set them apart from annotations.
<a href="https://fivethirtyeight.com/features/whats-behind-bidens-record-low-approval-rating/"><strong>FiveThirtyEight, 2022</strong></a>. Fonts: <a href="https://commercialtype.com/catalog/atlas/atlas_grotesk">Atlas Grotesk</a> and <a href="http://www.tipografiaramis.com/decima-mono-pro.html">Decima Mono Pro</a>. Uppercase can even be considered for<strong> short color key items</strong>. (FiveThirtyEight uses lowercase text for longer color keys, like <a href="https://projects.fivethirtyeight.com/2022-election-forecast/">here</a>.)
FiveThirtyEight, 2022. Fonts: Atlas Grotesk and Decima Mono Pro. Uppercase can even be considered for short color key items. (FiveThirtyEight uses lowercase text for longer color keys, like here.)

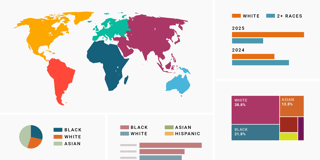
The most common place you'll find uppercase text in data visualizations is region labels (e.g. for countries or states) in maps. Here, uppercase text is often more letter-spaced than when used in charts:

<a href="https://www.wsj.com/articles/europes-record-breaking-heat-wave-scorches-the-continent-11658312621?st=b2262zxs5k7jdpb&amp;reflink=desktopwebshare_permalink"><strong>Wall Street Journal, 2022</strong></a>. Font: <a href="https://frerejones.com/families/retina">Retina Narrow</a>, letter-spacing: 0.08em.
Wall Street Journal, 2022. Font: Retina Narrow, letter-spacing: 0.08em.
<a href="https://graphics.reuters.com/CYCLING-FRANCE/egpbkggexvq/fr/"><strong>Reuters, 2022</strong></a>. Font: Source Sans Pro, letter-spacing: 0.1em.
Reuters, 2022. Font: Source Sans Pro, letter-spacing: 0.1em.
<strong><a href="https://graphics.reuters.com/MEXICO-PEMEX/FLARING/dwvkrjxagpm/index.html">Reuters, 2022</a></strong>. Font: Source Sans Pro, letter-spacing: 0.3em.
Reuters, 2022. Font: Source Sans Pro, letter-spacing: 0.3em.
<strong><a href="https://graphics.reuters.com/UKRAINE-CRISIS/WEAPONS/lbvgnzdnlpq/index.html">Reuters, 2022</a></strong>. Font: Source Sans Pro, letter-spacing: 0.2em ("Moldova") and 0.75 ("Ukraine")
Reuters, 2022. Font: Source Sans Pro, letter-spacing: 0.2em ("Moldova") and 0.75 ("Ukraine")
<strong><a href="https://www.bloomberg.com/news/articles/2022-02-27/germany-backs-new-lng-plants-in-bid-to-cut-russian-dependence?cmpid%3D=socialflow-twitter-graphics">Bloomberg, 2022</a></strong>. Font: Haas Grotesk, letter-spacing: 0.2em.
Bloomberg, 2022. Font: Haas Grotesk, letter-spacing: 0.2em.

There's no need to retype with capslock on to create uppercase text — most graphics software has a button for that. In Datawrapper locator maps, too, you can make text uppercase and letter-space your markers with the click of a button.

👉 Read more: UPPERCASE in UI Design by Bradley Nice


I hope this article was helpful! If there's any essential advice I missed, leave it in the comments or write to me at lisa@datawrapper.de. I'm looking forward to hearing from you.

Portrait of Lisa Charlotte Muth

Lisa Charlotte Muth (she/her, @lisacmuth, @lisacmuth@vis.social) is Datawrapper’s head of communications. She writes about best practices in data visualization and thinks of new ways to excite you about charts and maps. Lisa lives in Berlin.

Sign up to our newsletters to get notified about everything new on our blog.