Covid vis All blog topics
>
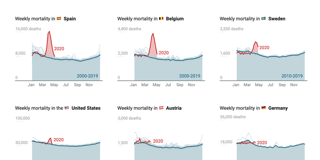
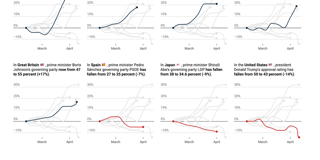
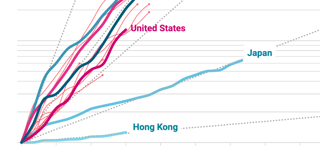
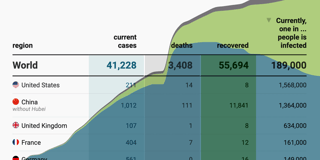
Maps, charts, and tables that show the impact of the COVID-19 pandemic on our lives and societies.
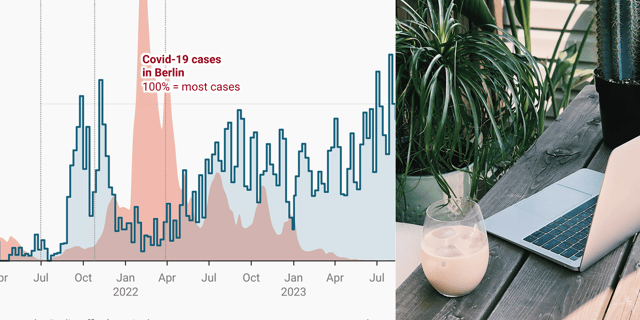
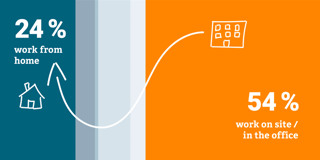
The “new normal”: Charts on how we at Datawrapper slowly return to the office
Return to the office? Work from home? In this Weekly Chart, we share numbers on the situation at Datawrapper.