Data visualization isn’t a hard science. Here’s what we — and others — believe to be true and important.
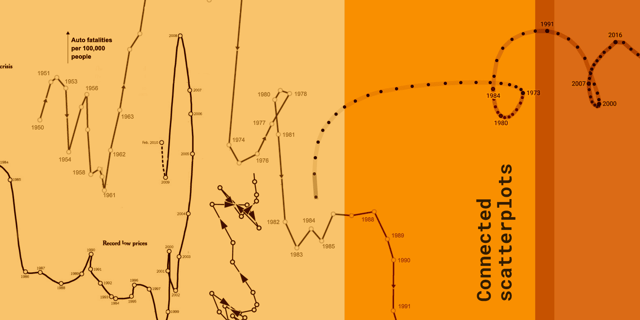
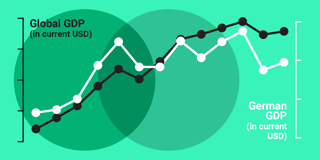
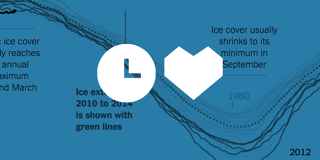
Are connected scatterplots so bad?
How to get started with data visualization
It’s time for a more sophisticated color contrast check for data visualizations
Shirley Wu and Nadieh Bremer on freelancing, finding inspiration, and sharing the full journey
In defense of simple charts
The case for choosing clarity over complexity in data visualizations
What we wrote about in the last year
An alternative to pink & blue: Colors for gender data
Why not to use two axes, and what to use instead
The case against diverging stacked bars
“The reward of interacting is understanding”
“The key to a good data story is the story itself”
Respect your readers’ time
That Frustrating Thing about Creating Data Vis in Newsrooms