The climate archive hidden in the trees

Hi hi! This is Eleni from the Map team. This week, as I’m taking on the Weekly Chart, I’d like to introduce the world of trees and what makes them data vis experts!
Imagine you’re a scientist and you’re looking for climate data from the Middle Ages. How do you get it?
First you need to find a tree with a healthy and very thick trunk. Then, using a special increment borer, you drill all the way to the center and extract a long, thin cylinder of wood — the core, also known as the “carrot,” because it has the shape of a carrot. The process is minimally invasive and doesn’t harm the tree if the technique is done correctly.
This procedure, and the interpretation of the core sample, is called ✨ dendrochronology! ✨
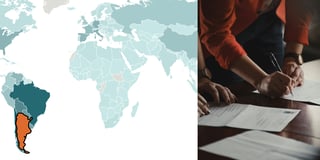
![[aria-description]](https://datawrapper.dwcdn.net/EFGDu/4/full.png)
What can we learn from the “carrot”? The sample can give two kinds of information:
1. The age of the tree
If you’ve ever seen a piece of cut wood, you’ve probably noticed a series of rings radiating out from the center. Some are light in color, and others are darker. Each pair of rings, one light and one dark, represents a full year of the tree’s growth. So if a tree has 200 pairs of rings, that means it’s 200 years old!
The rings are counted from the center outward toward the bark, because trees grow horizontally by adding a new layer of wood around the previous year’s growth. That means the outermost layer shows the most recent year of growth at the time the tree was cut.
2. Environmental conditions in each year of the tree's life
Darker colored rings indicate the dry season, with low precipitation, while lighter rings mark the wet season, with higher rainfall.
Wider rings are from years when the tree grew a lot, indicating favorable climate conditions with plenty of rain and ideal temperatures. Narrower rings suggest stressful conditions, such as extreme drought, very low or very high temperatures, fire, or disease.
Dendrochronology doesn't just tell us about the life of an individual tree. There are collections of dendrochronological data from all around the world like Dendro Database or the database of the Archaelogy Data Service. By comparing the rings from many trees in a specific region, scientists can uncover how the environmental conditions have changed there over time. It's like the trees themselves are a climate database, just waiting for us to read them.
Thank you for reading! Come back next week for a Weekly chart from our developer Pascal!