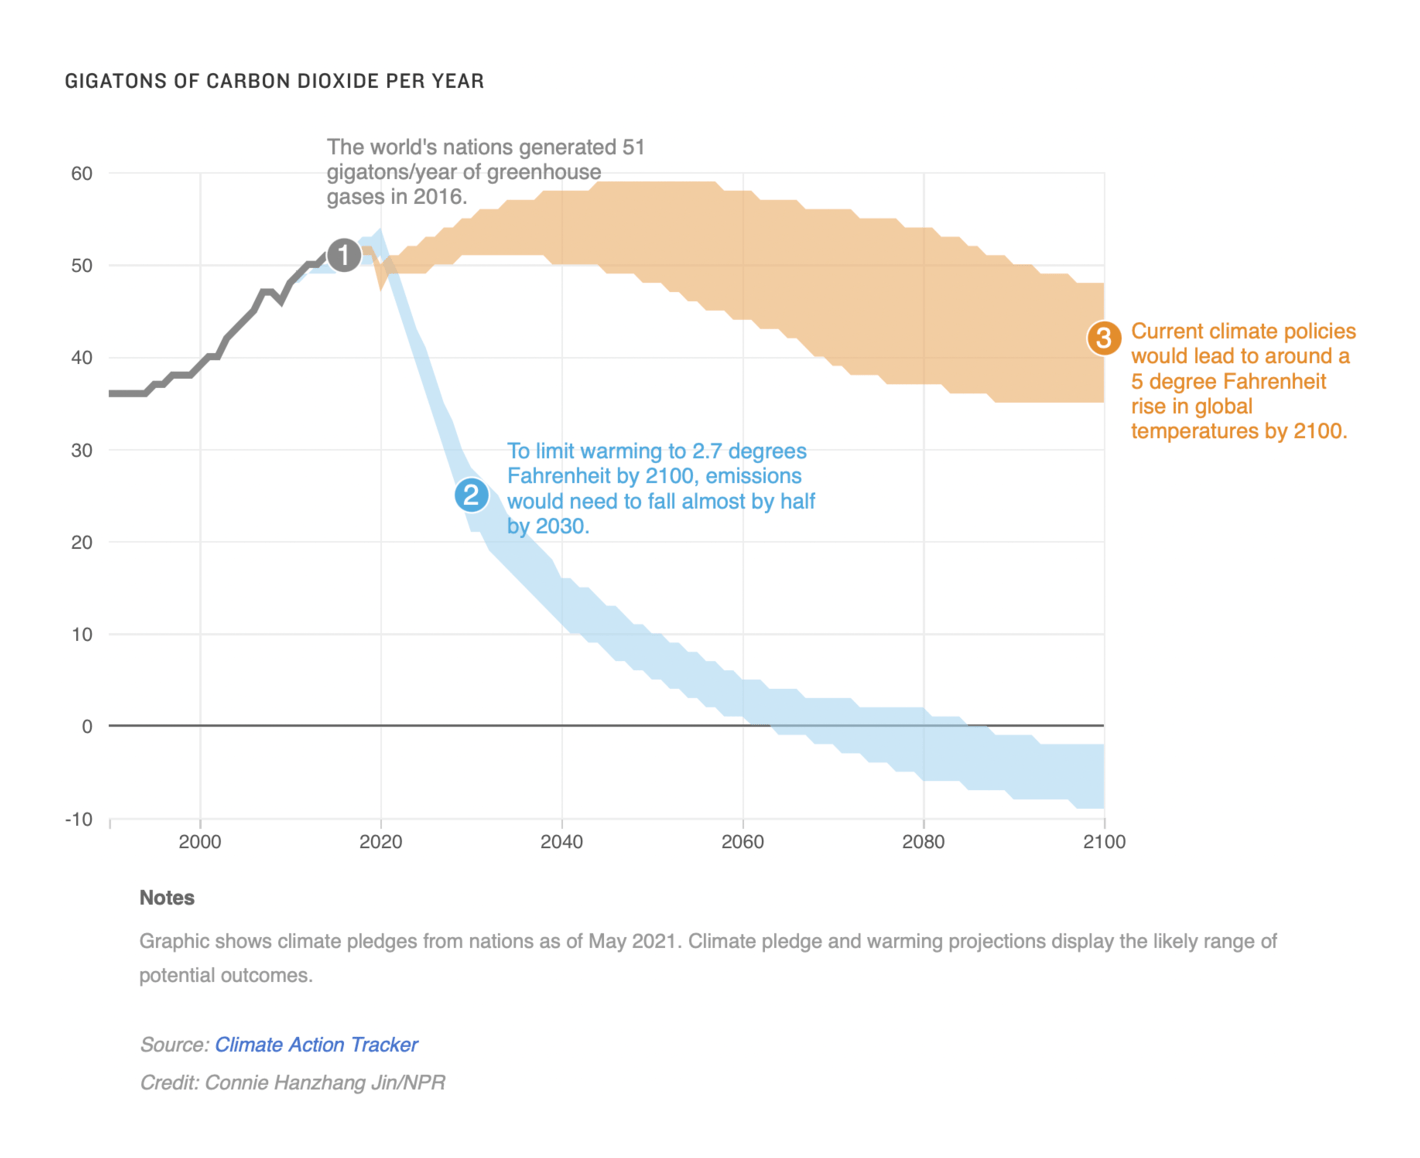
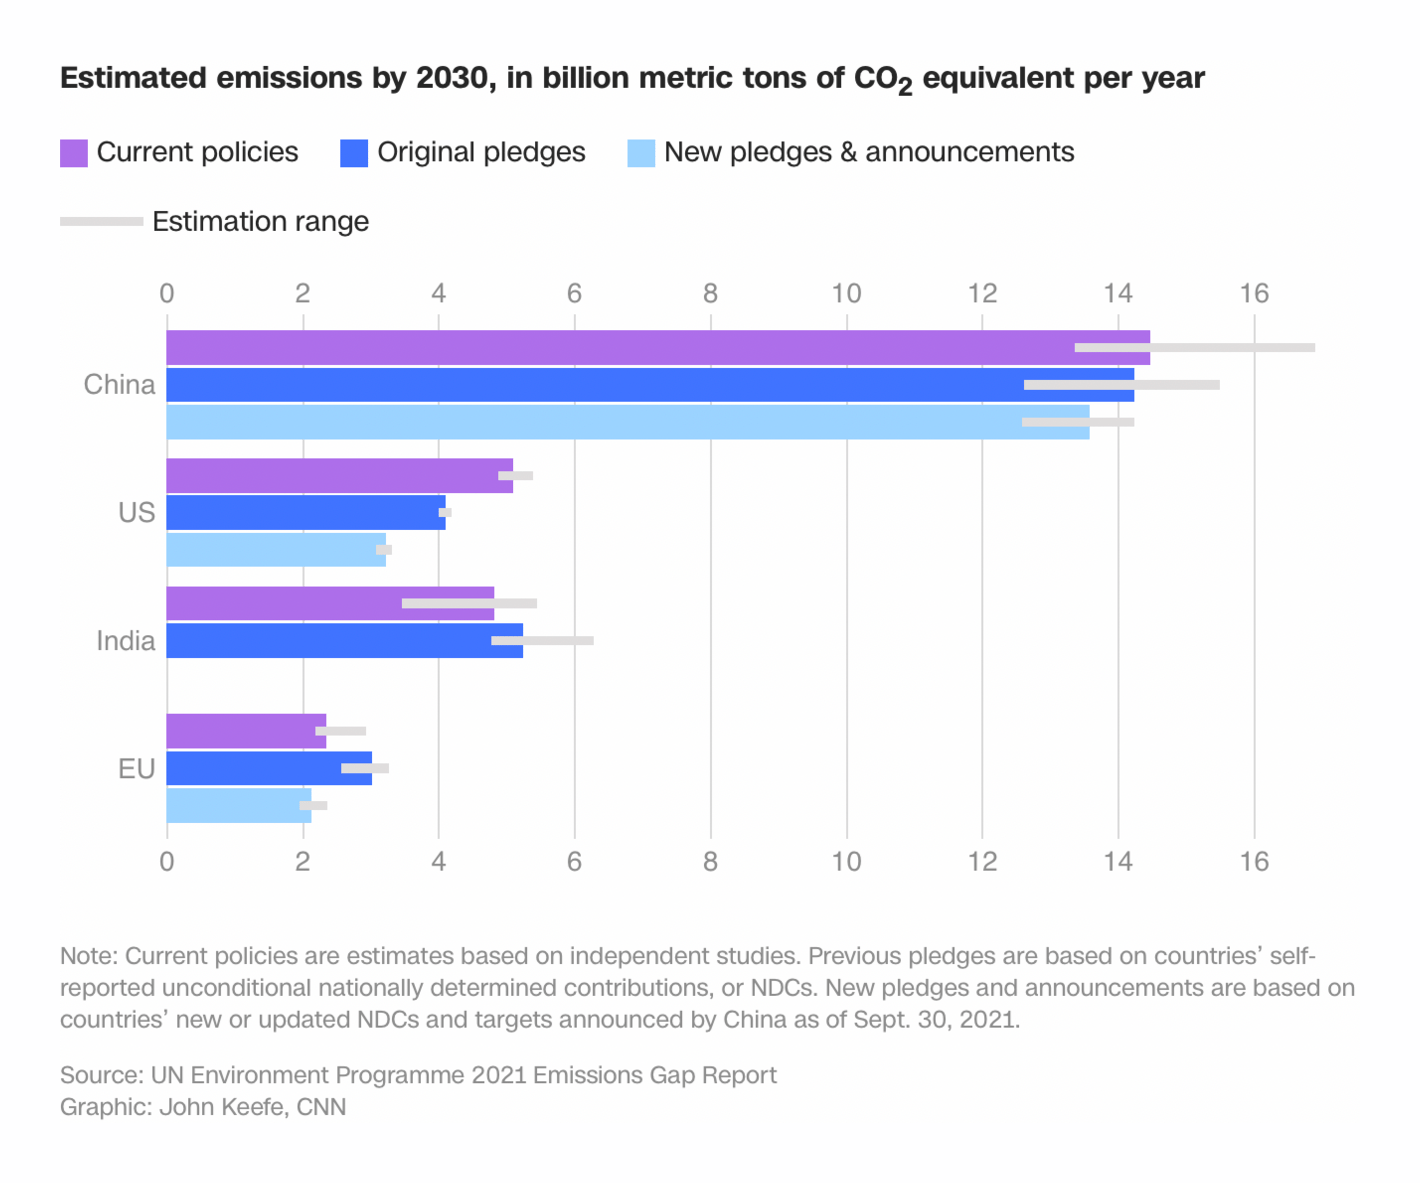
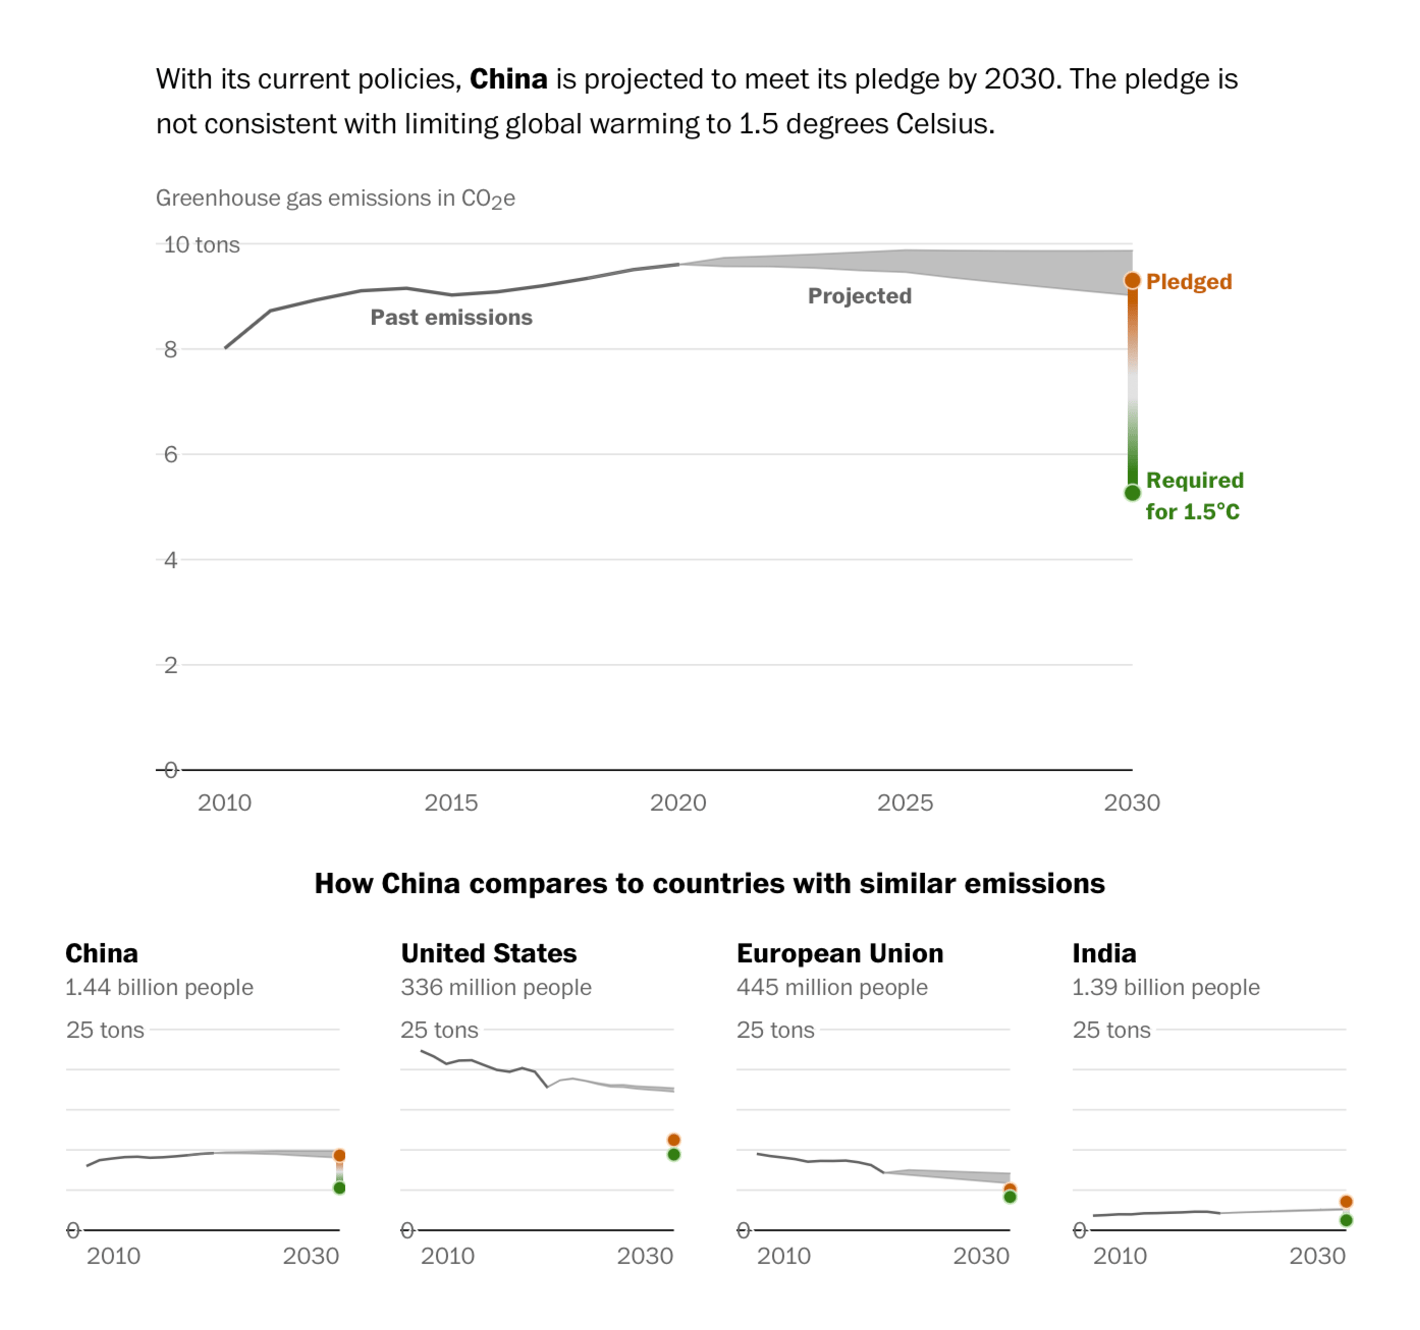
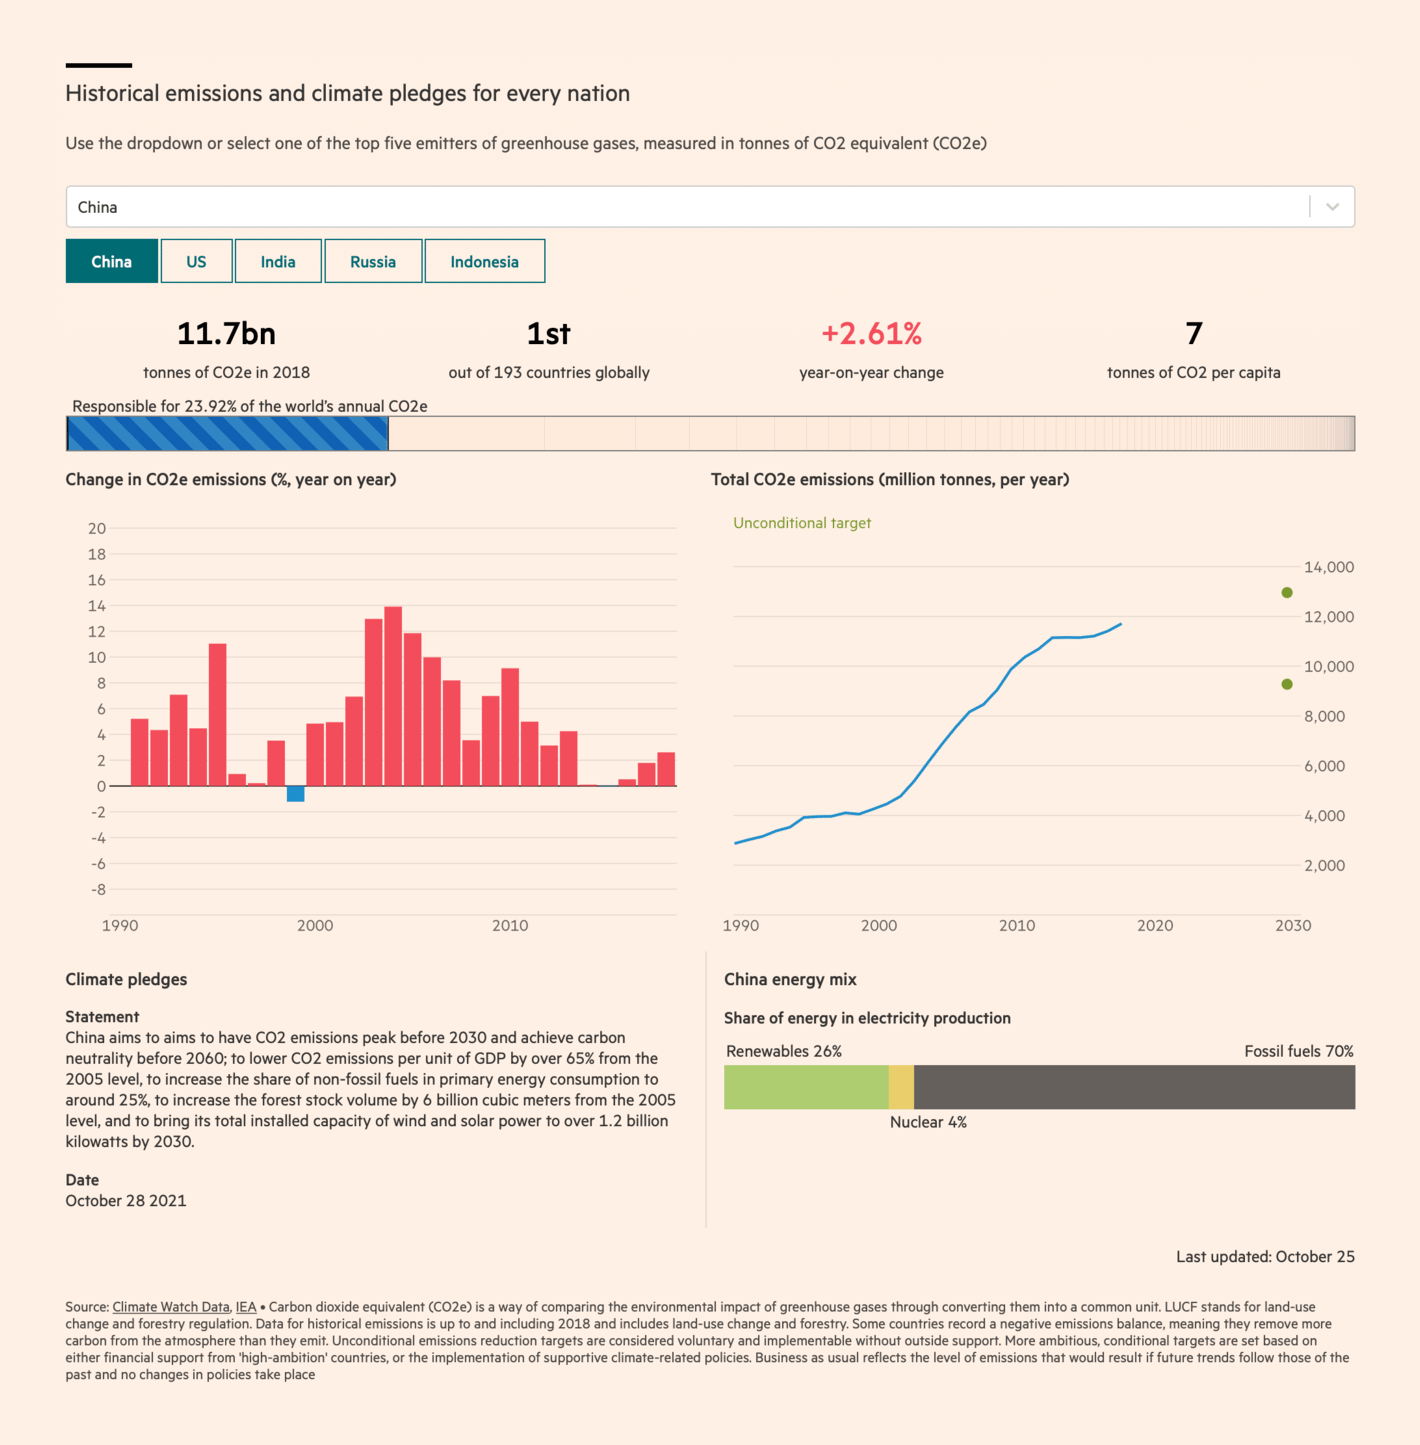
All eyes were on Glasgow this week for the start of the COP26 climate conference . For the first time since the 2015 Paris Agreement, countries will be expected to submit new, lowered national targets for greenhouse gas emissions. To show why that's needed, these charts looked at what each country has pledged so far and how far off-track that still leaves us:
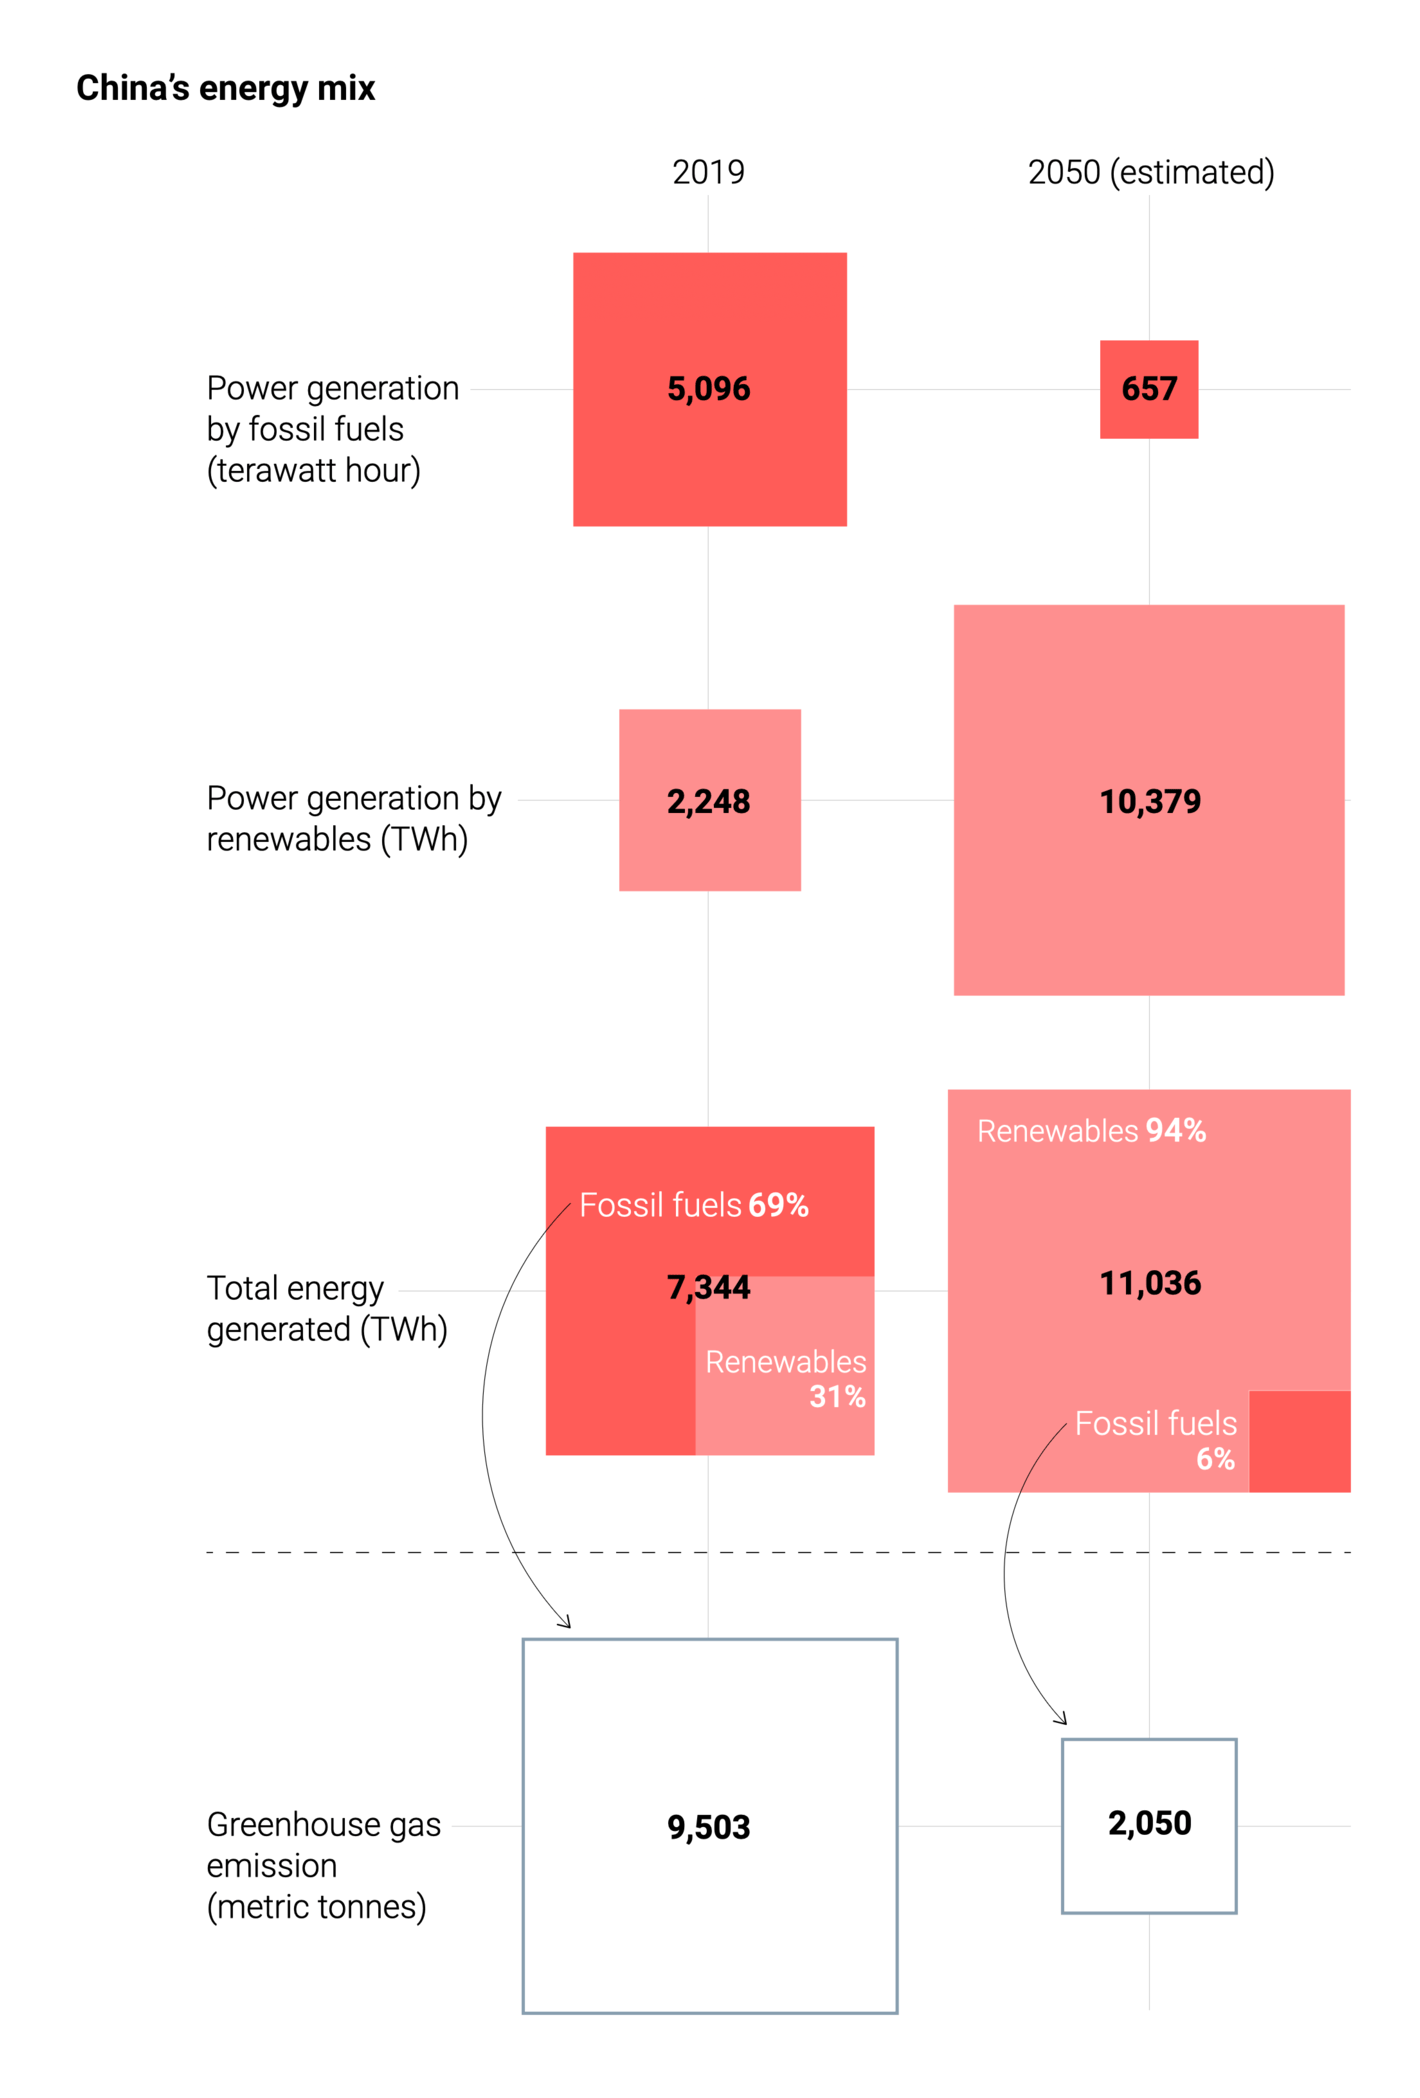
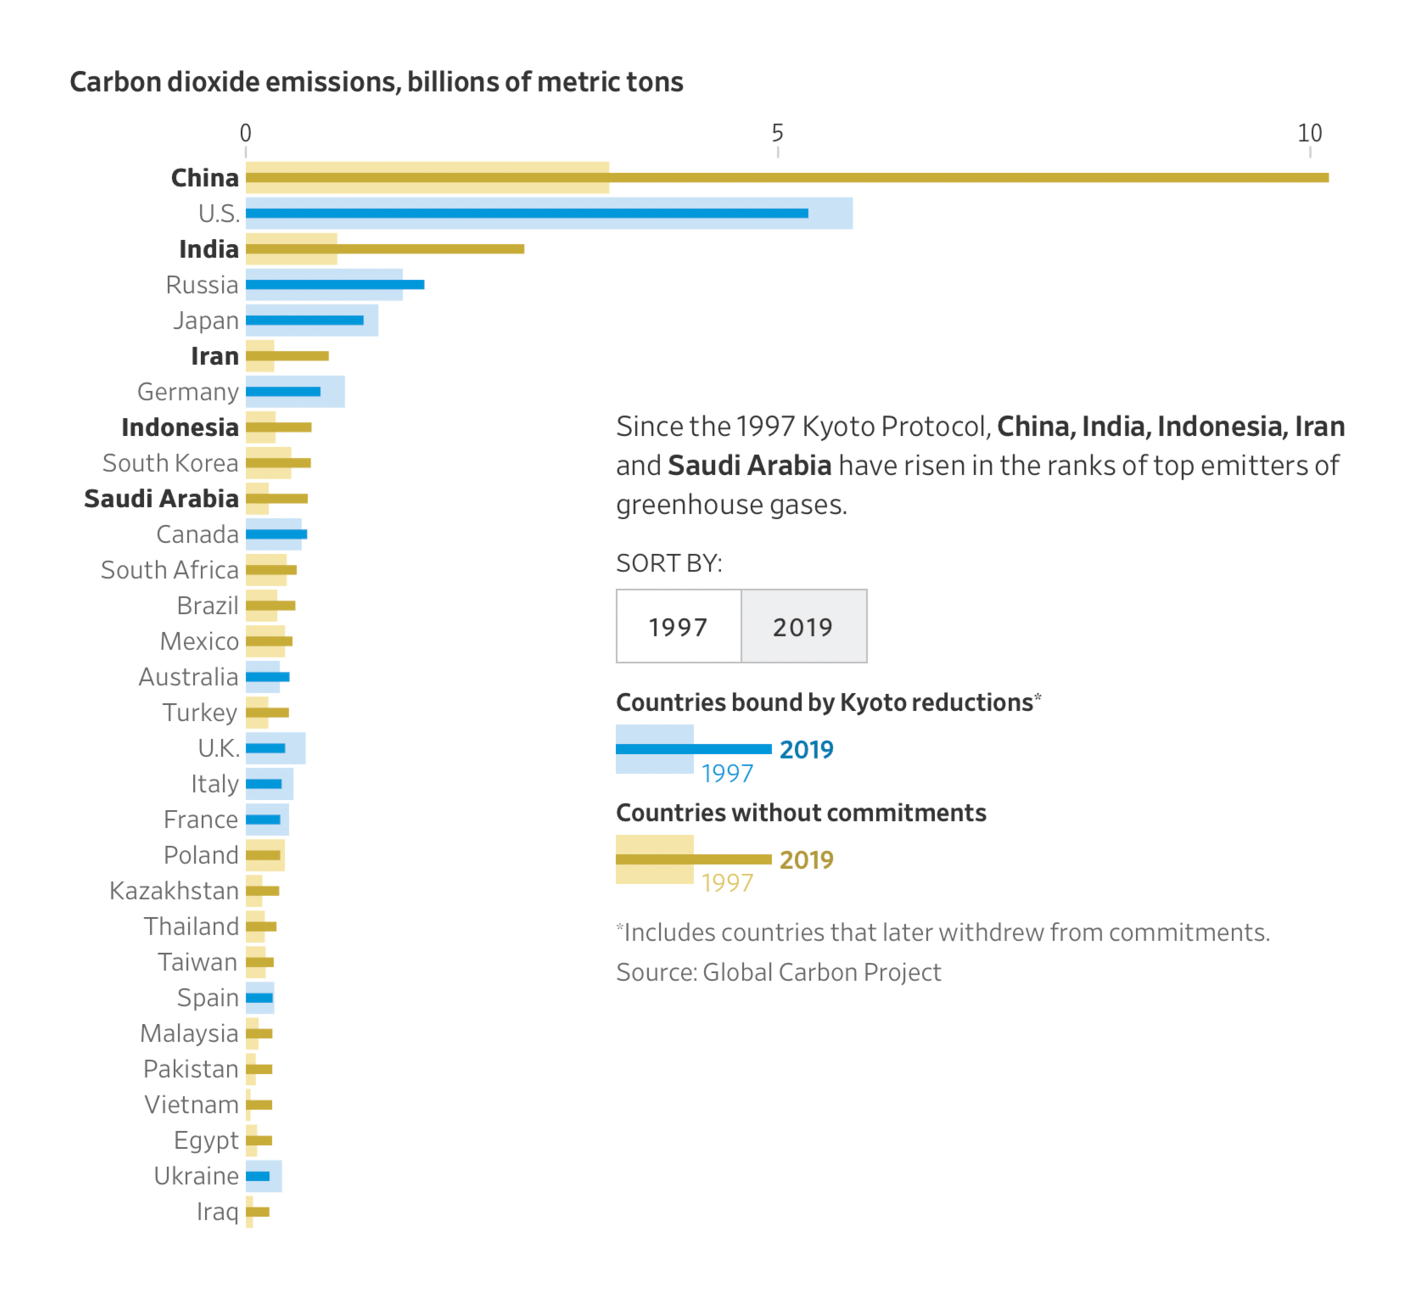
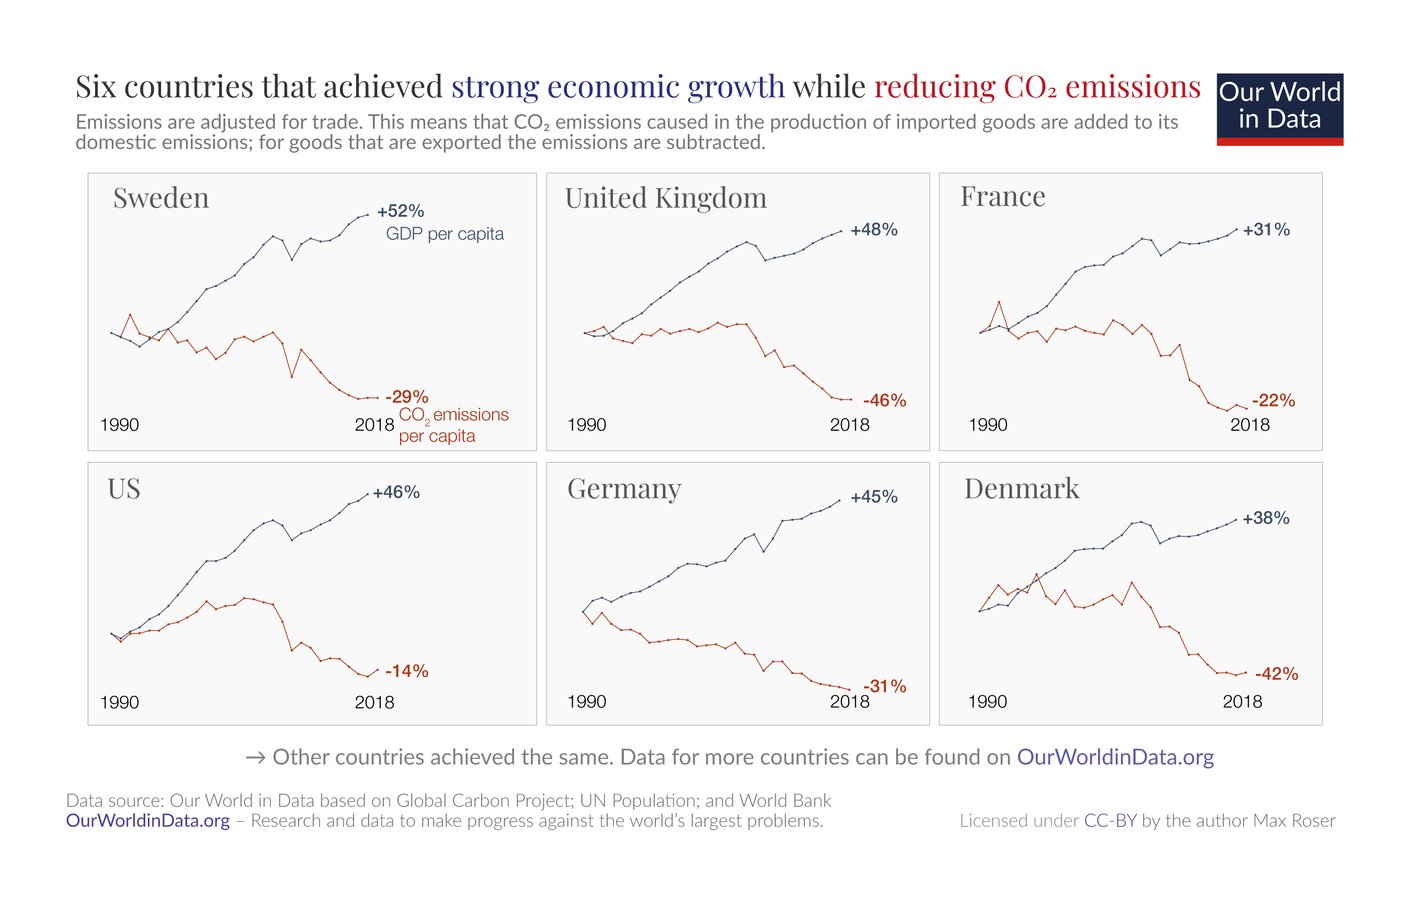
NPR: These 4 charts explain why the stakes are so high at the U.N. climate summit The Economist: Why the world needs negative emissions Financial Times: Going it alone on climate change is not an option, Draghi warns G20 Zeit Online: Wo steht die Welt beim Klimaschutz? CNN: The world promised to cut greenhouse gas emissions. These countries aren't meeting their targets The Washington Post: National climate pledges are too weak to avoid catastrophic warming. Most countries are on track to miss them anyway South China Morning Post: Global warming: is time running out? Of course, some countries bear more responsibility than others for the past and future of carbon emissions. In recent decades, developing and developed economies have followed very different paths:
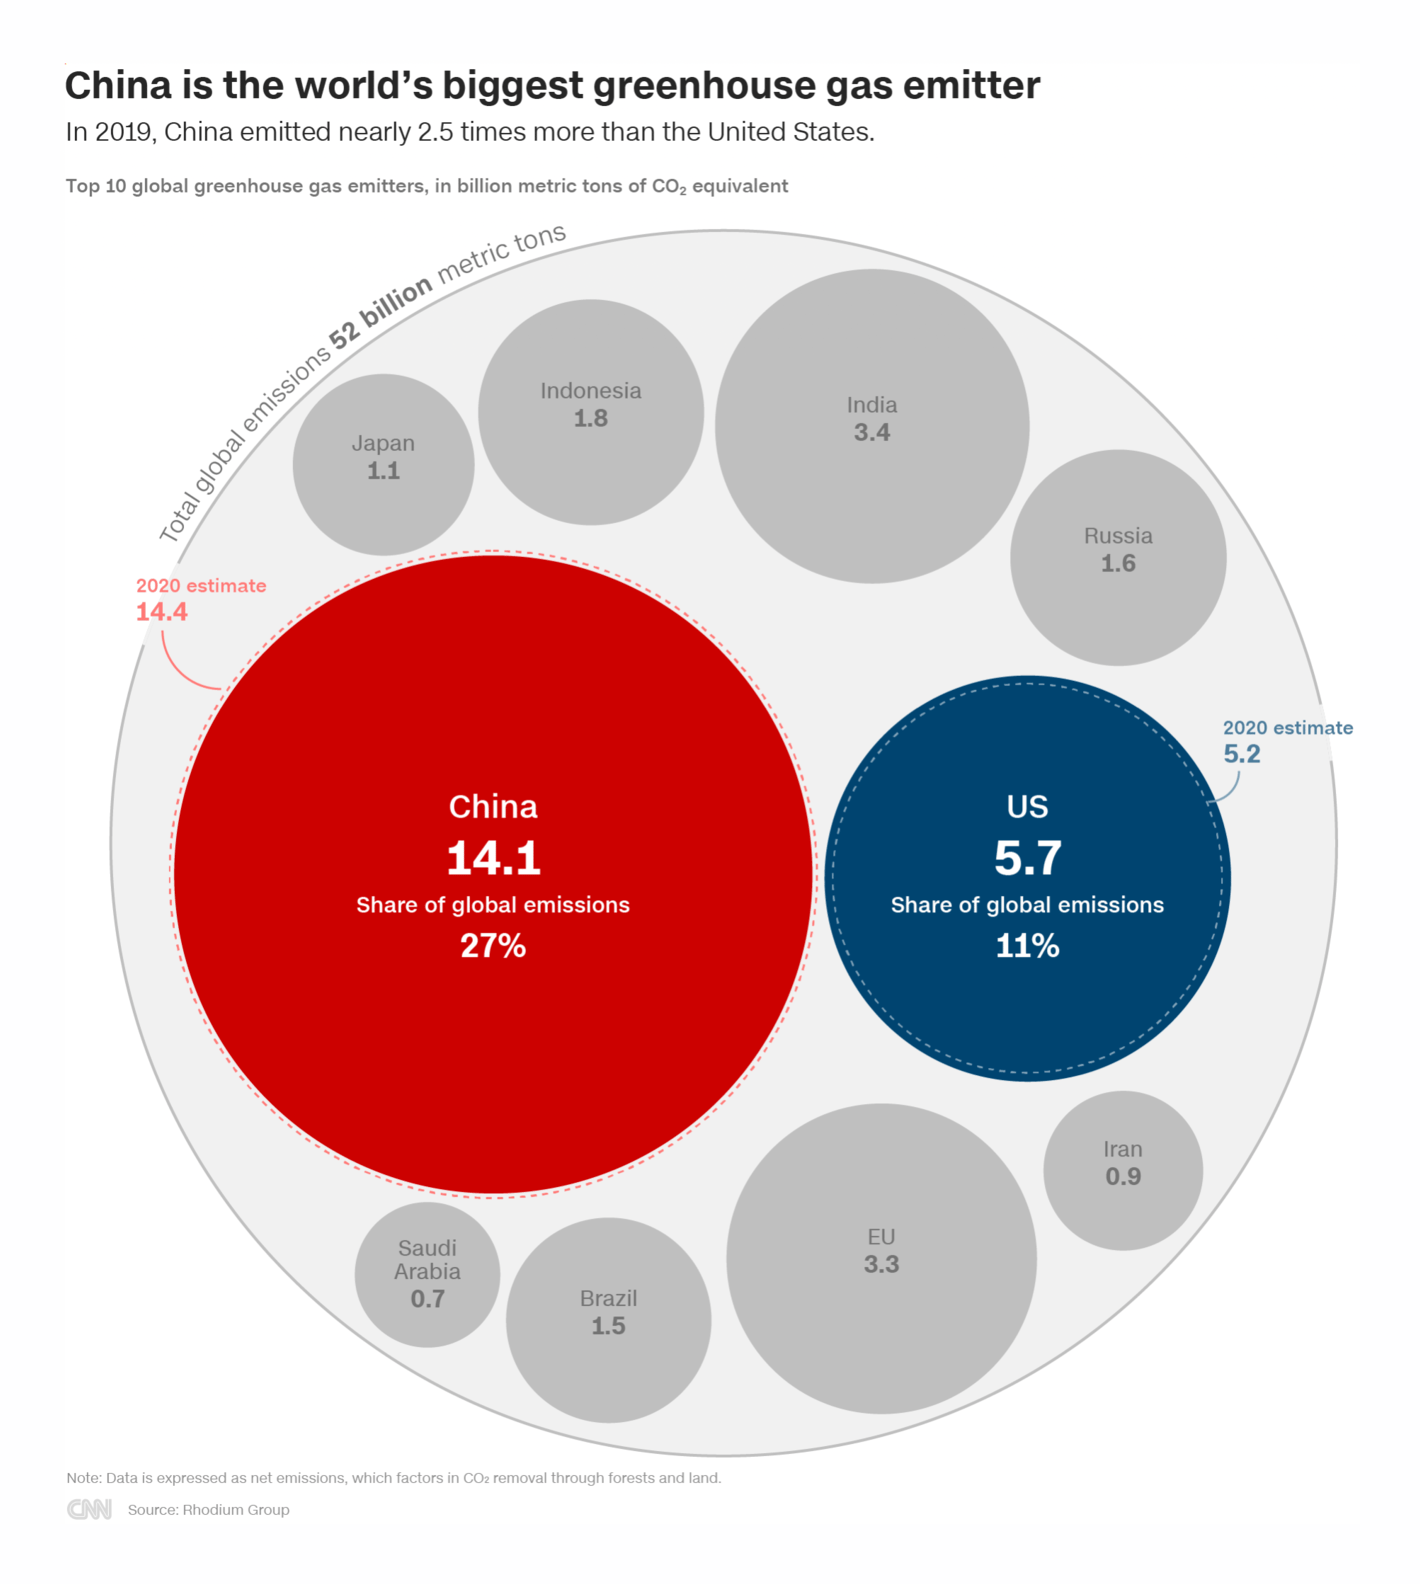
The Wall Street Journal: COP26 Climate Summit Consensus Is Sought After Decades of False Starts CNN: US vs. China: How the world's two biggest emitters stack up on climate Max Roser: "It's been a reality for a long time that trade-adjusted CO2 emissions decline in high-income countries. But here on Twitter people still ask me whether there is *any country* that ever achieved this!" October 31 (Tweet Financial Times: COP26: How every country’s emissions and climate pledges compare If you need a quick refresher on why this whole "emissions" thing is such serious business — these charts have you covered with the big picture and the human-sized one:
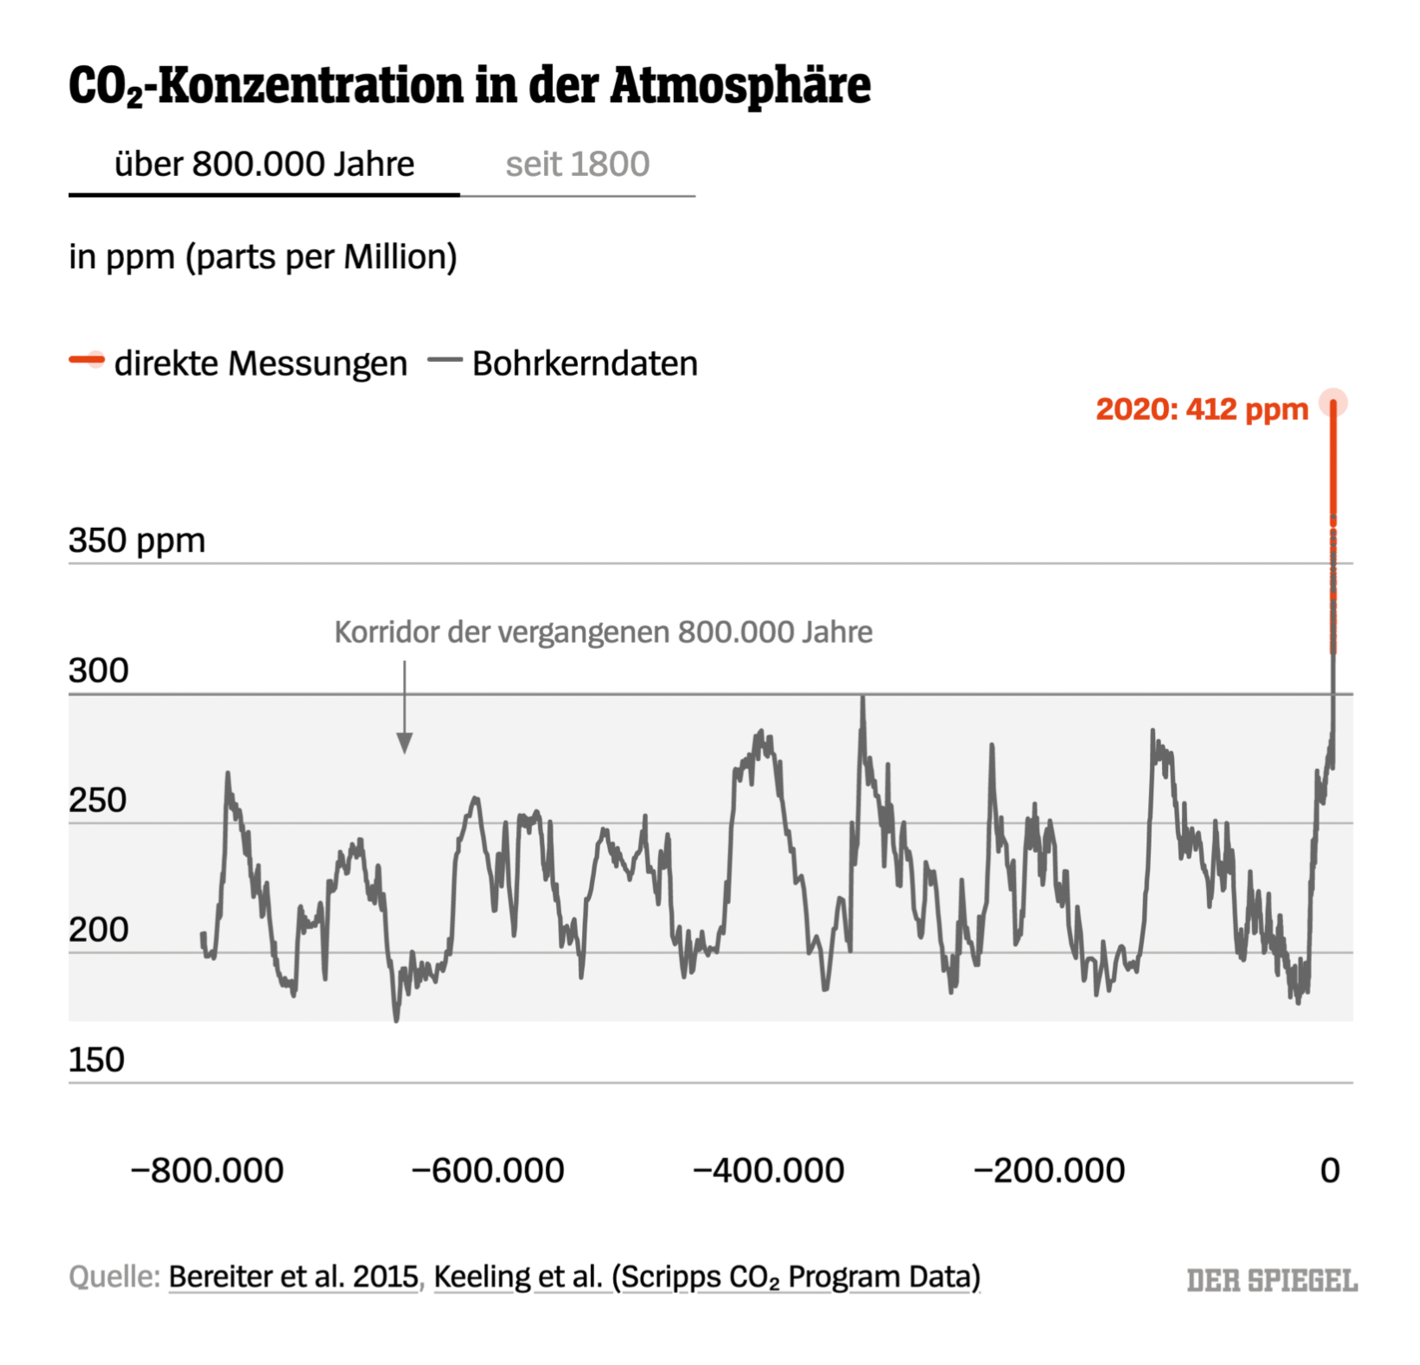
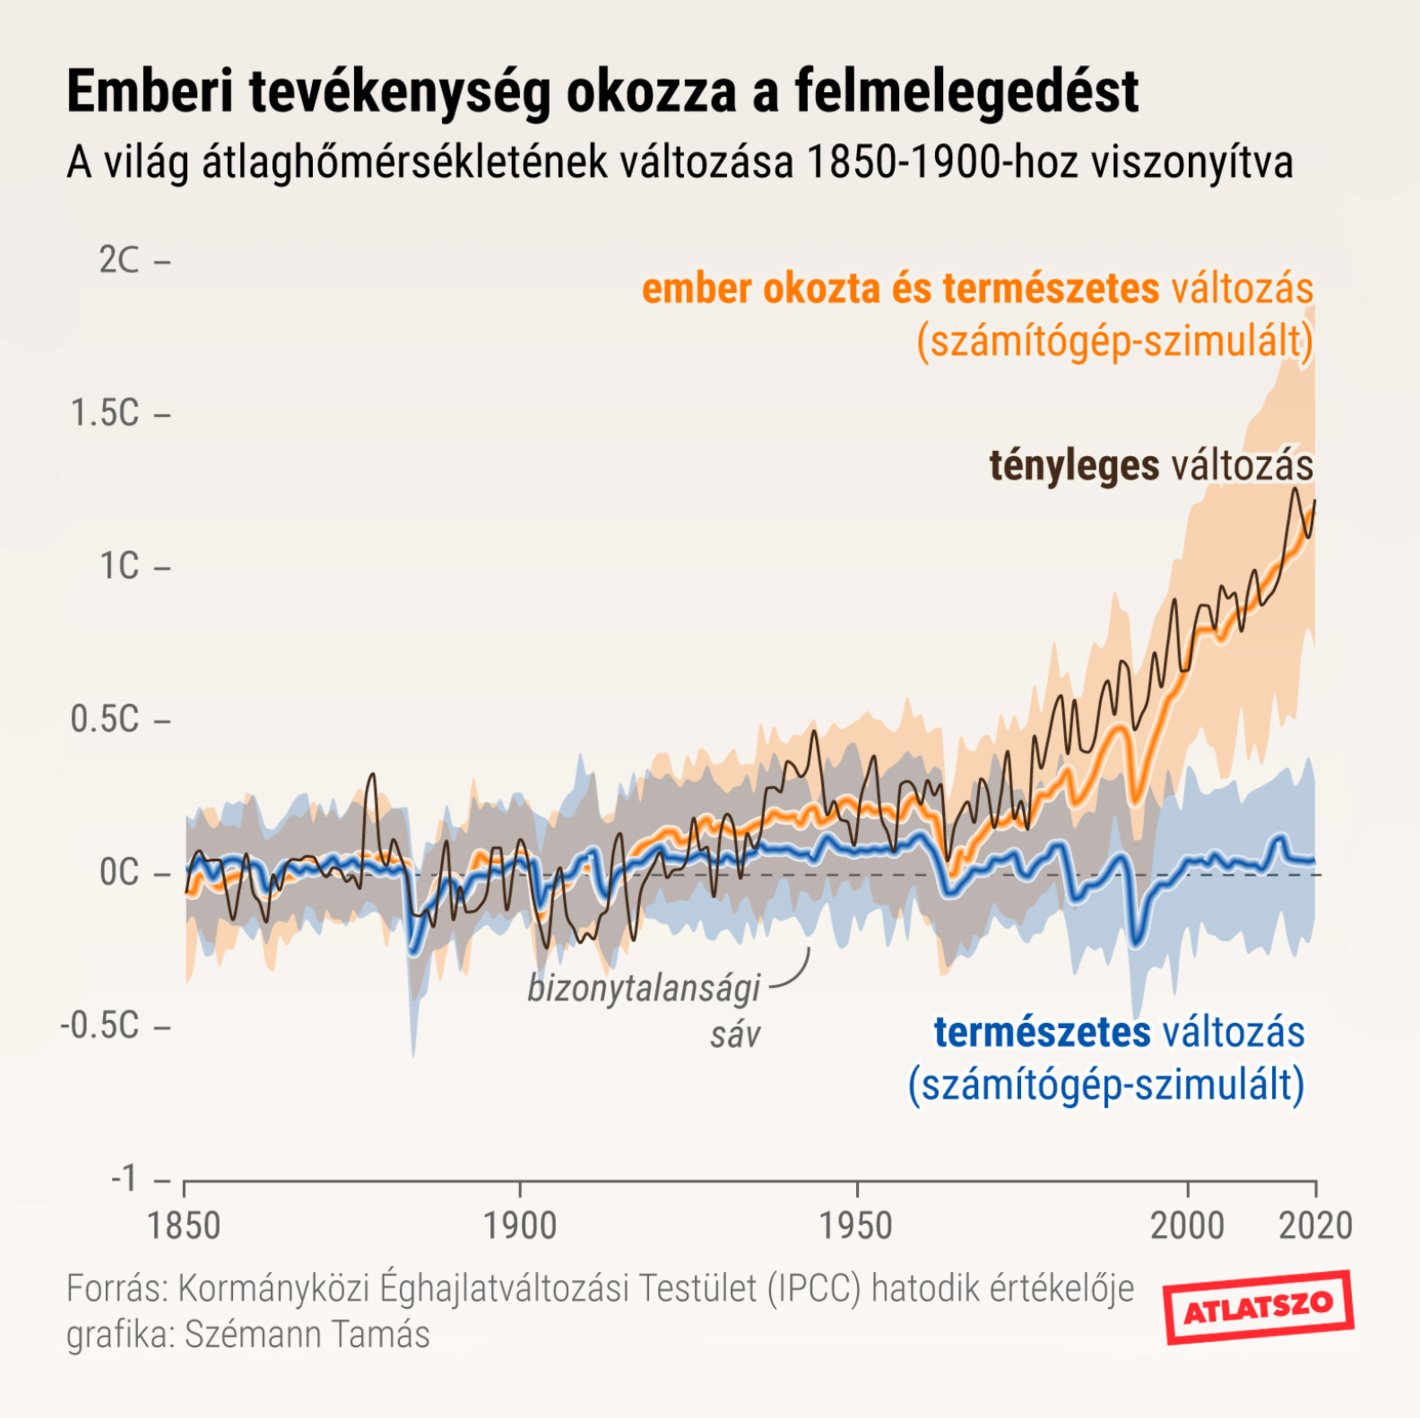
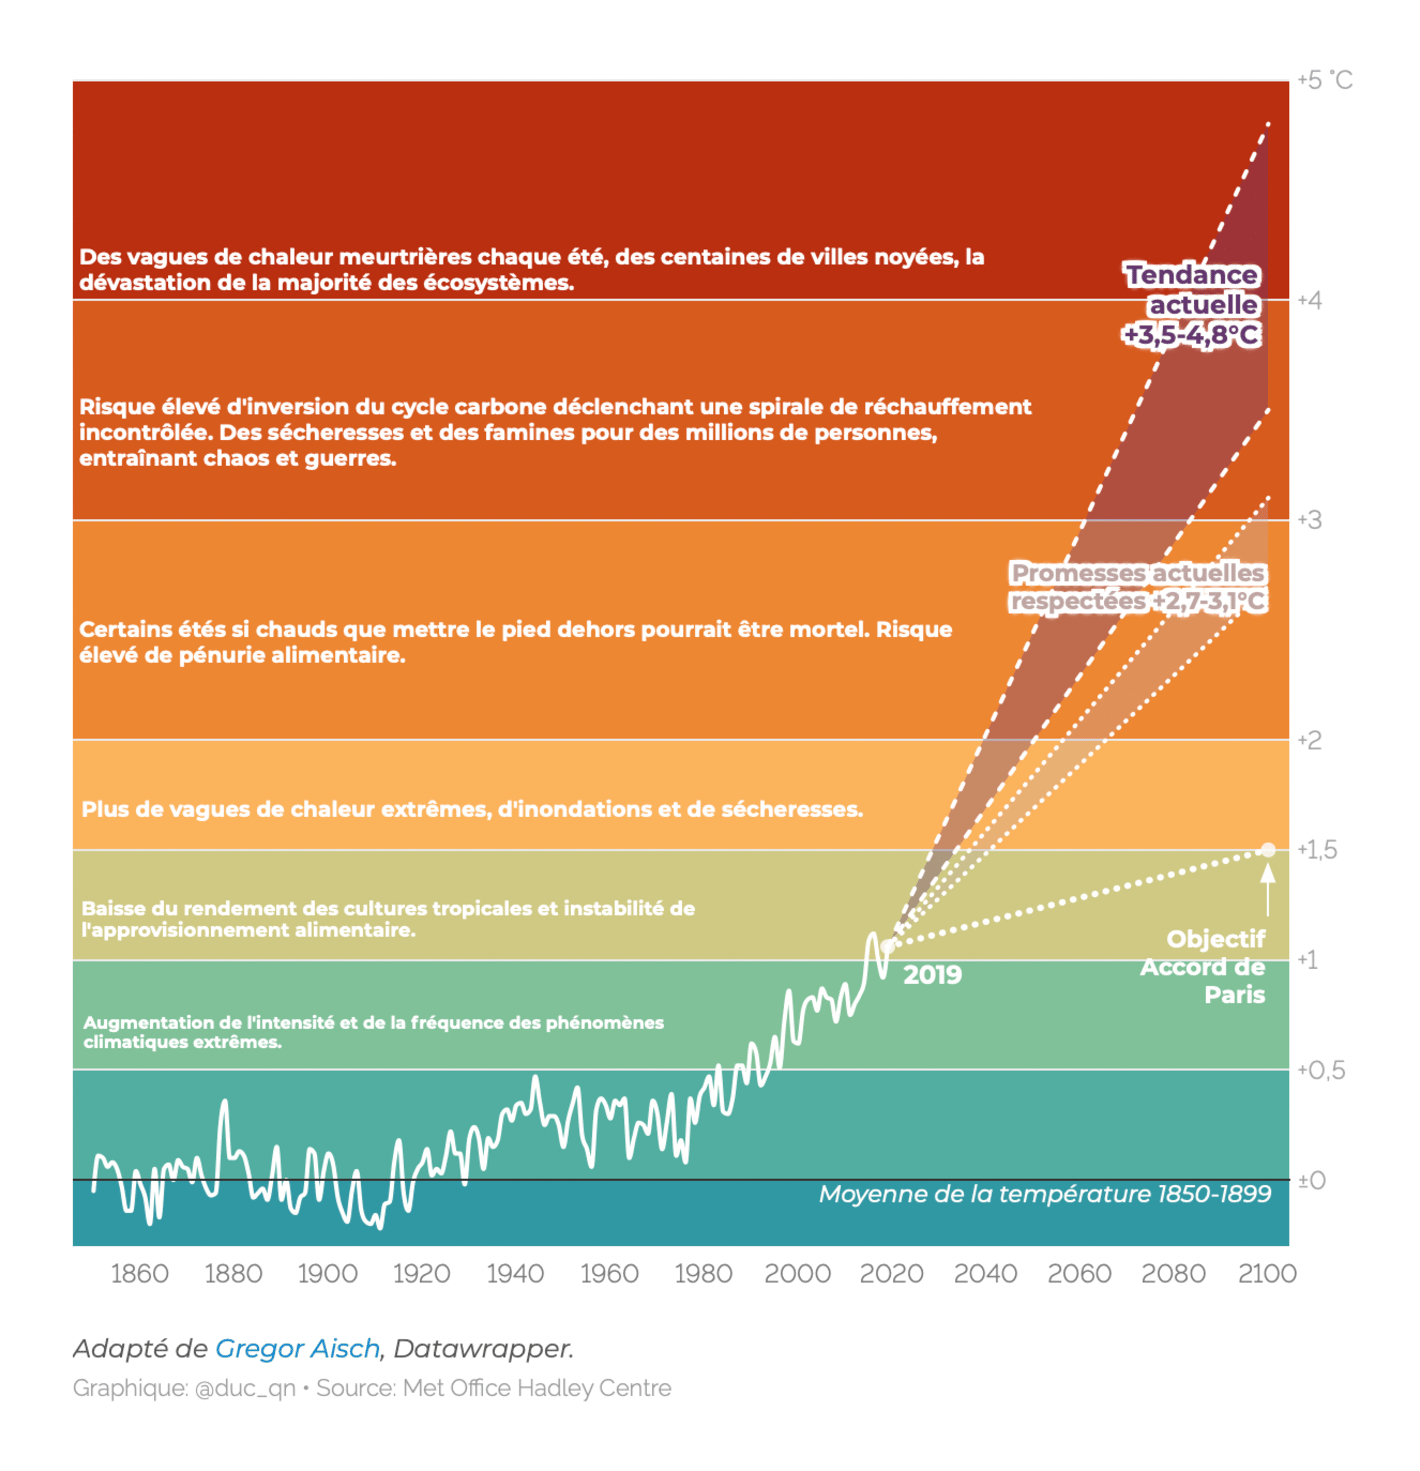
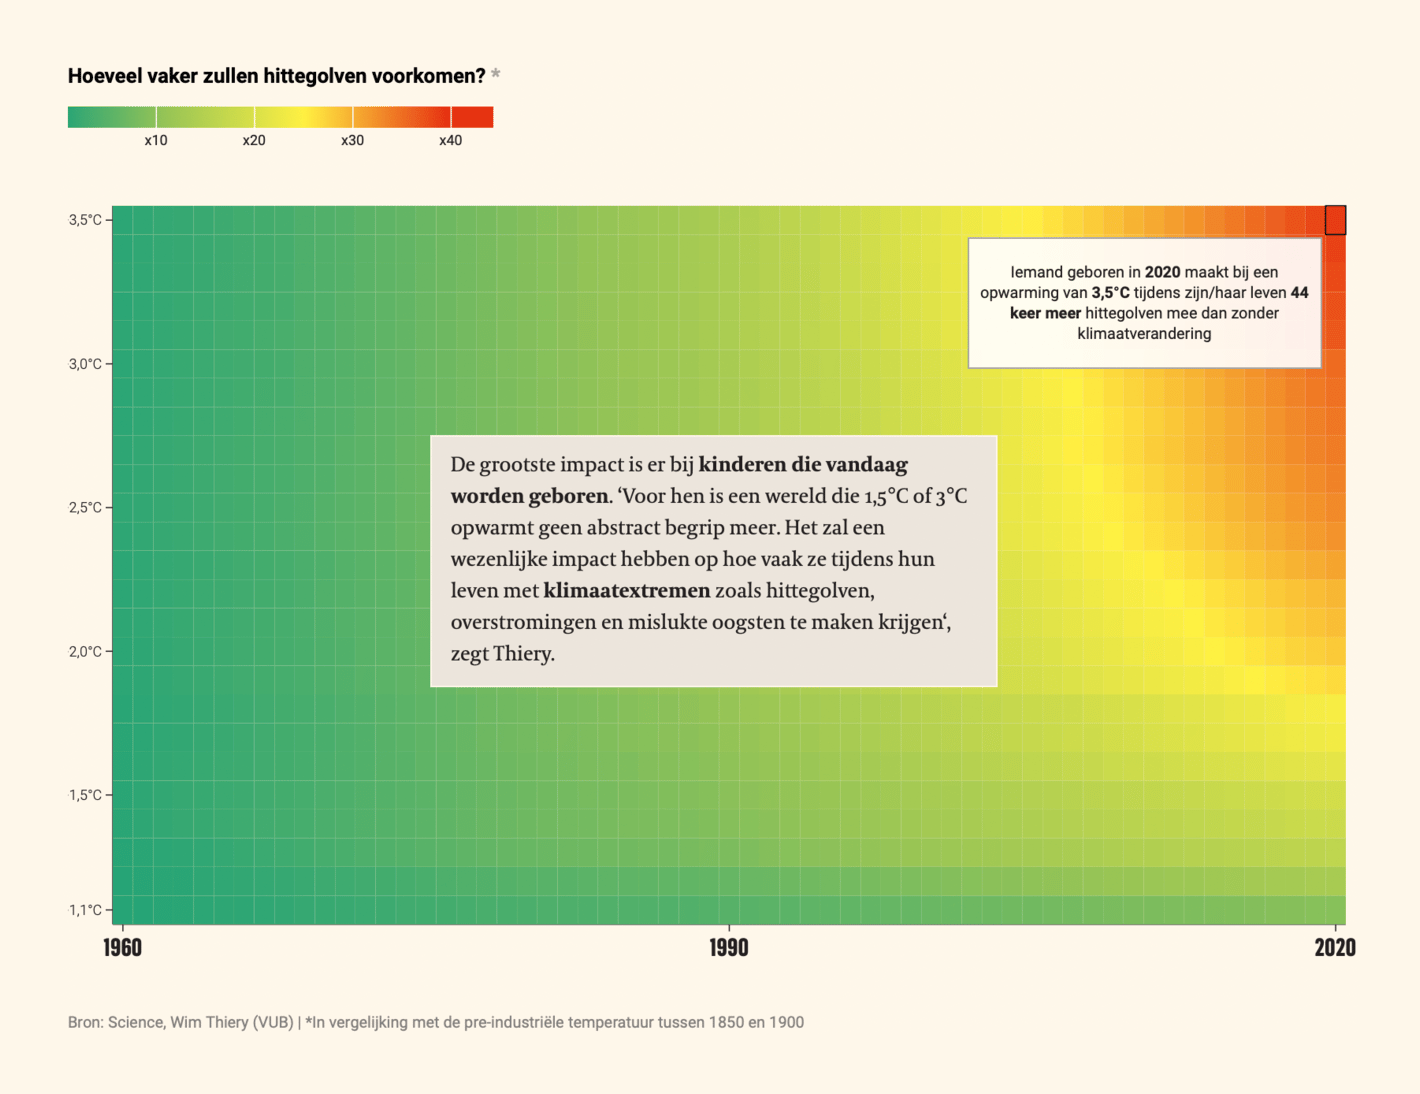
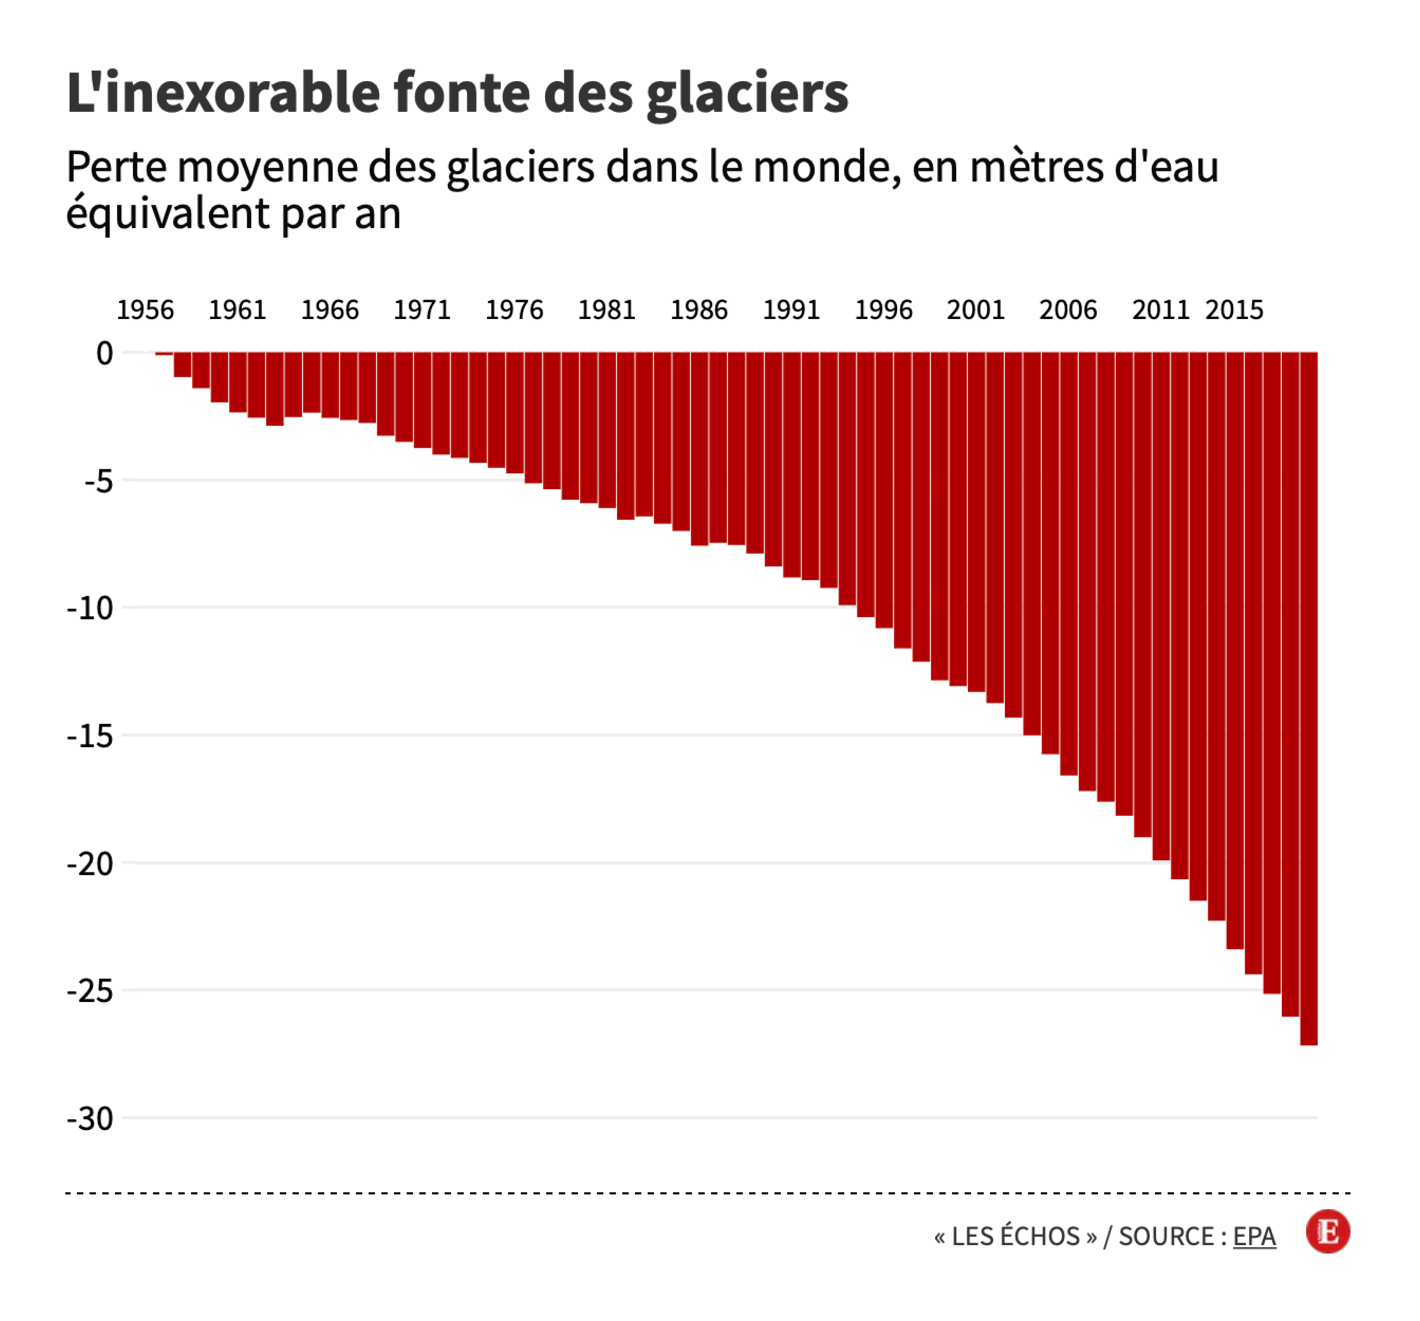
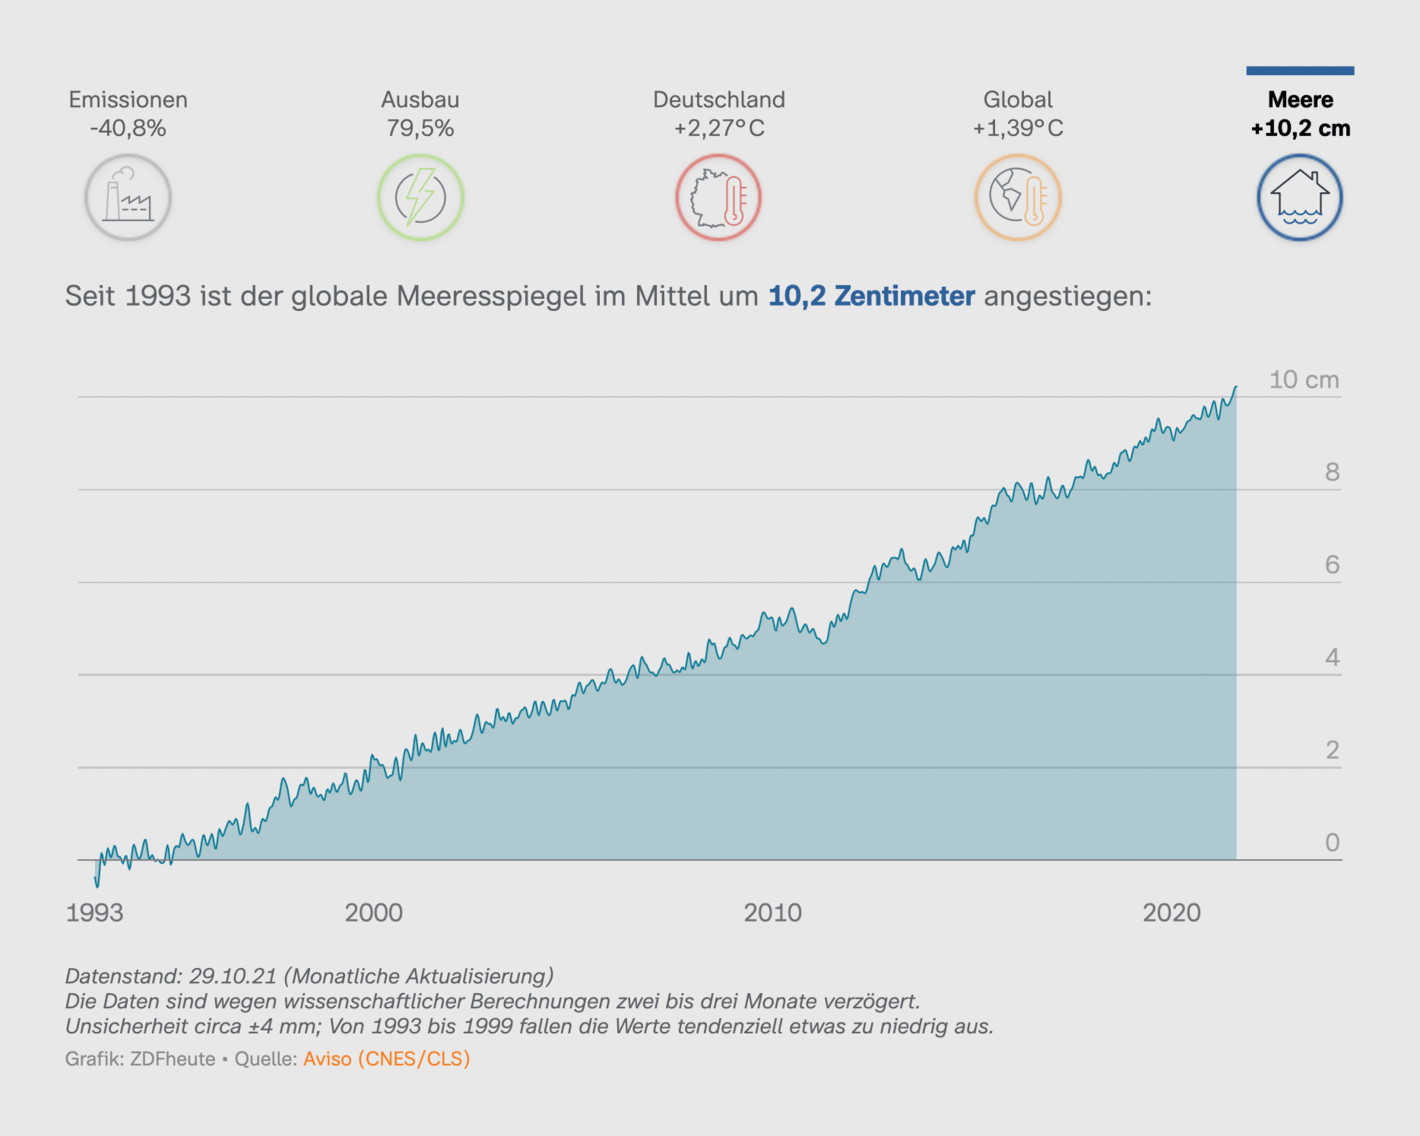
Patrick Stotz: "Die gegenwärtige Erwärmung bricht mit dem seit min. 800.000 Jahren bestehenden Auf und Ab der Kalt- und Warmzeiten. CO2- und Temperaturkurve sind eng gekoppelt. Das CO2-Niveau ist jetzt wahrscheinlich auf dem höchsten Stand seit min. 3 Mio. Jahren," October 31 (Tweet Article Átlátszó: Vörös kód az emberiségnek Le Temps: Quatre graphiques pour comprendre les enjeux climatiques De Tijd: Jongsten hebben in Glasgow meest te verliezen The effects of climate change are already all around us. This week the spotlight was on melting ice and rising seas:
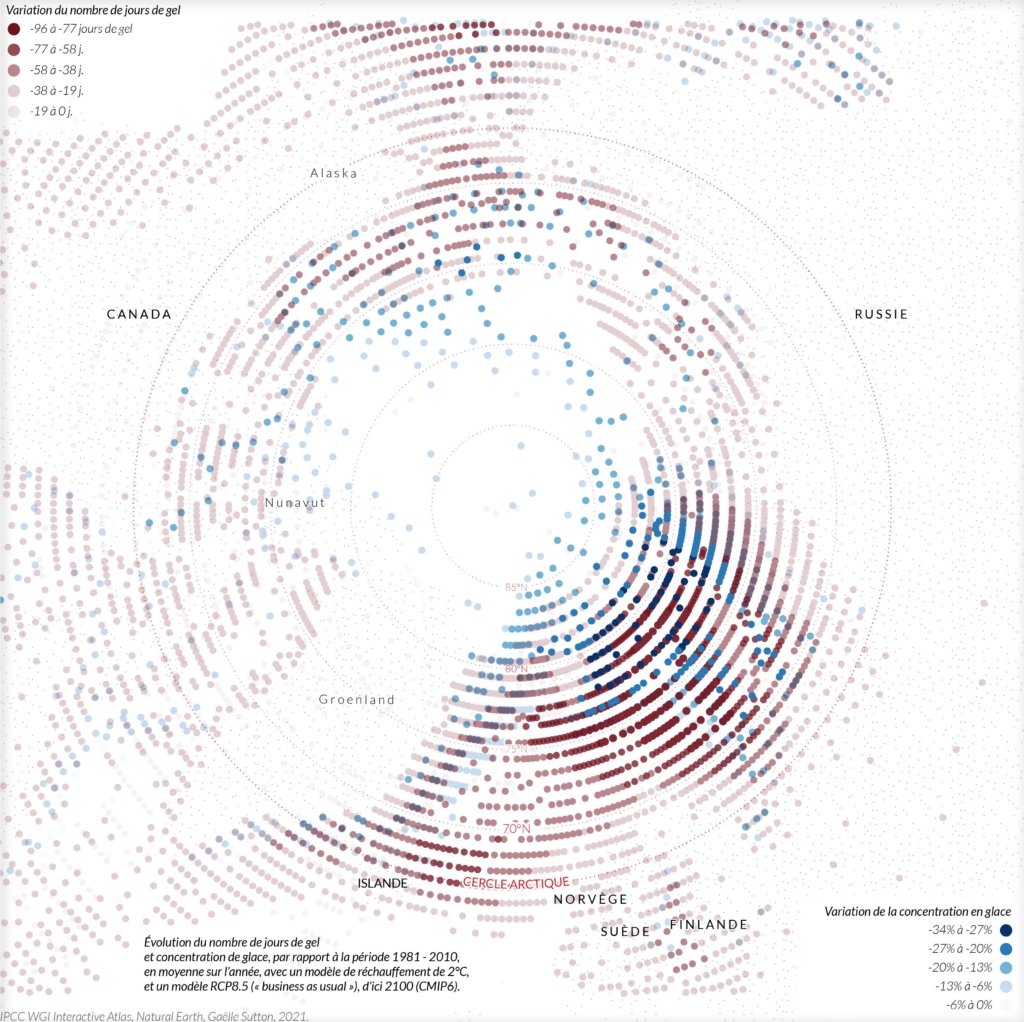
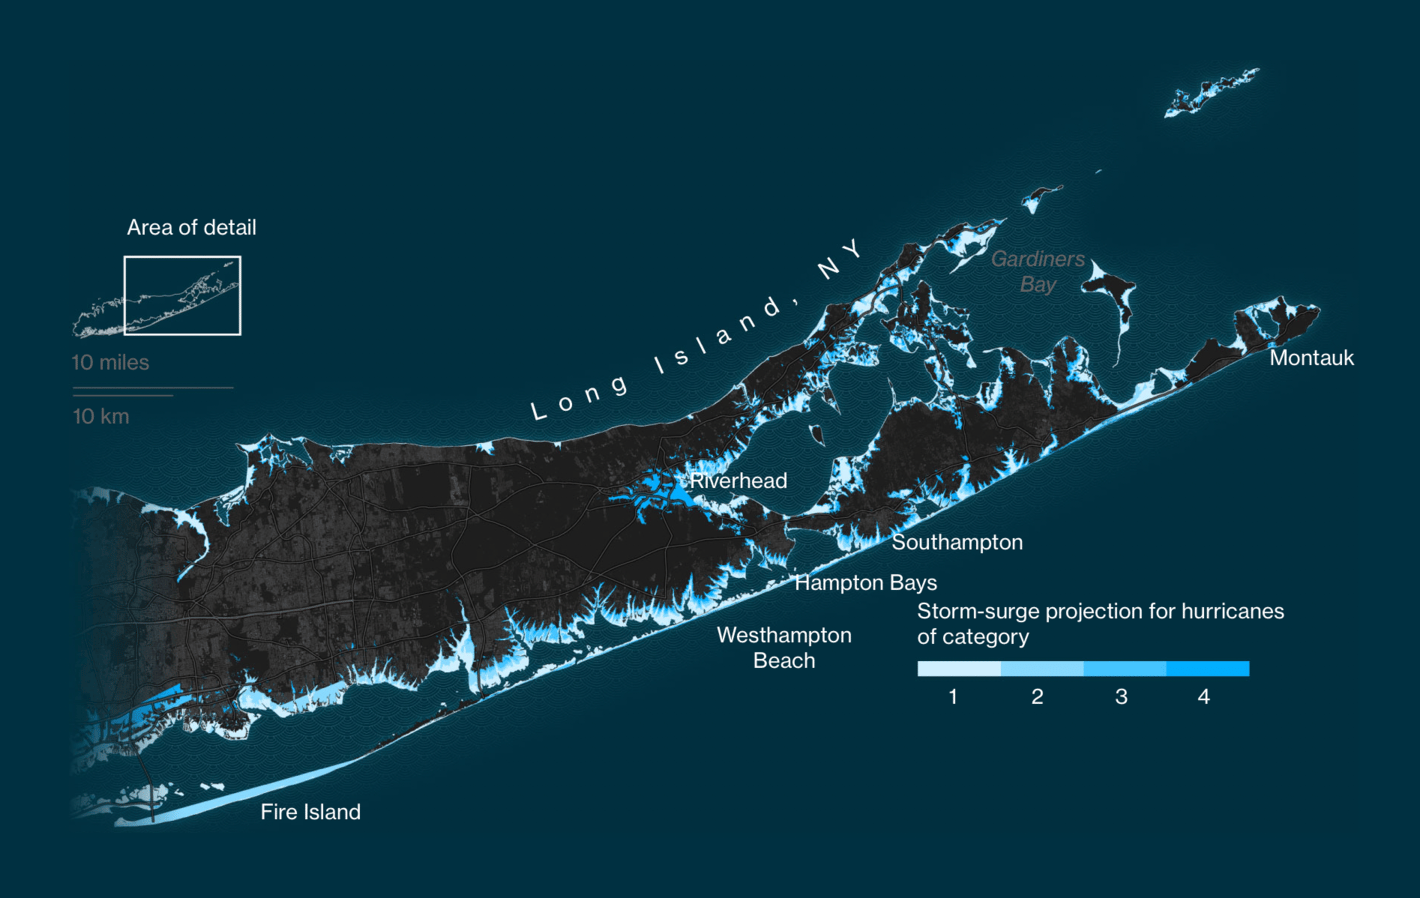
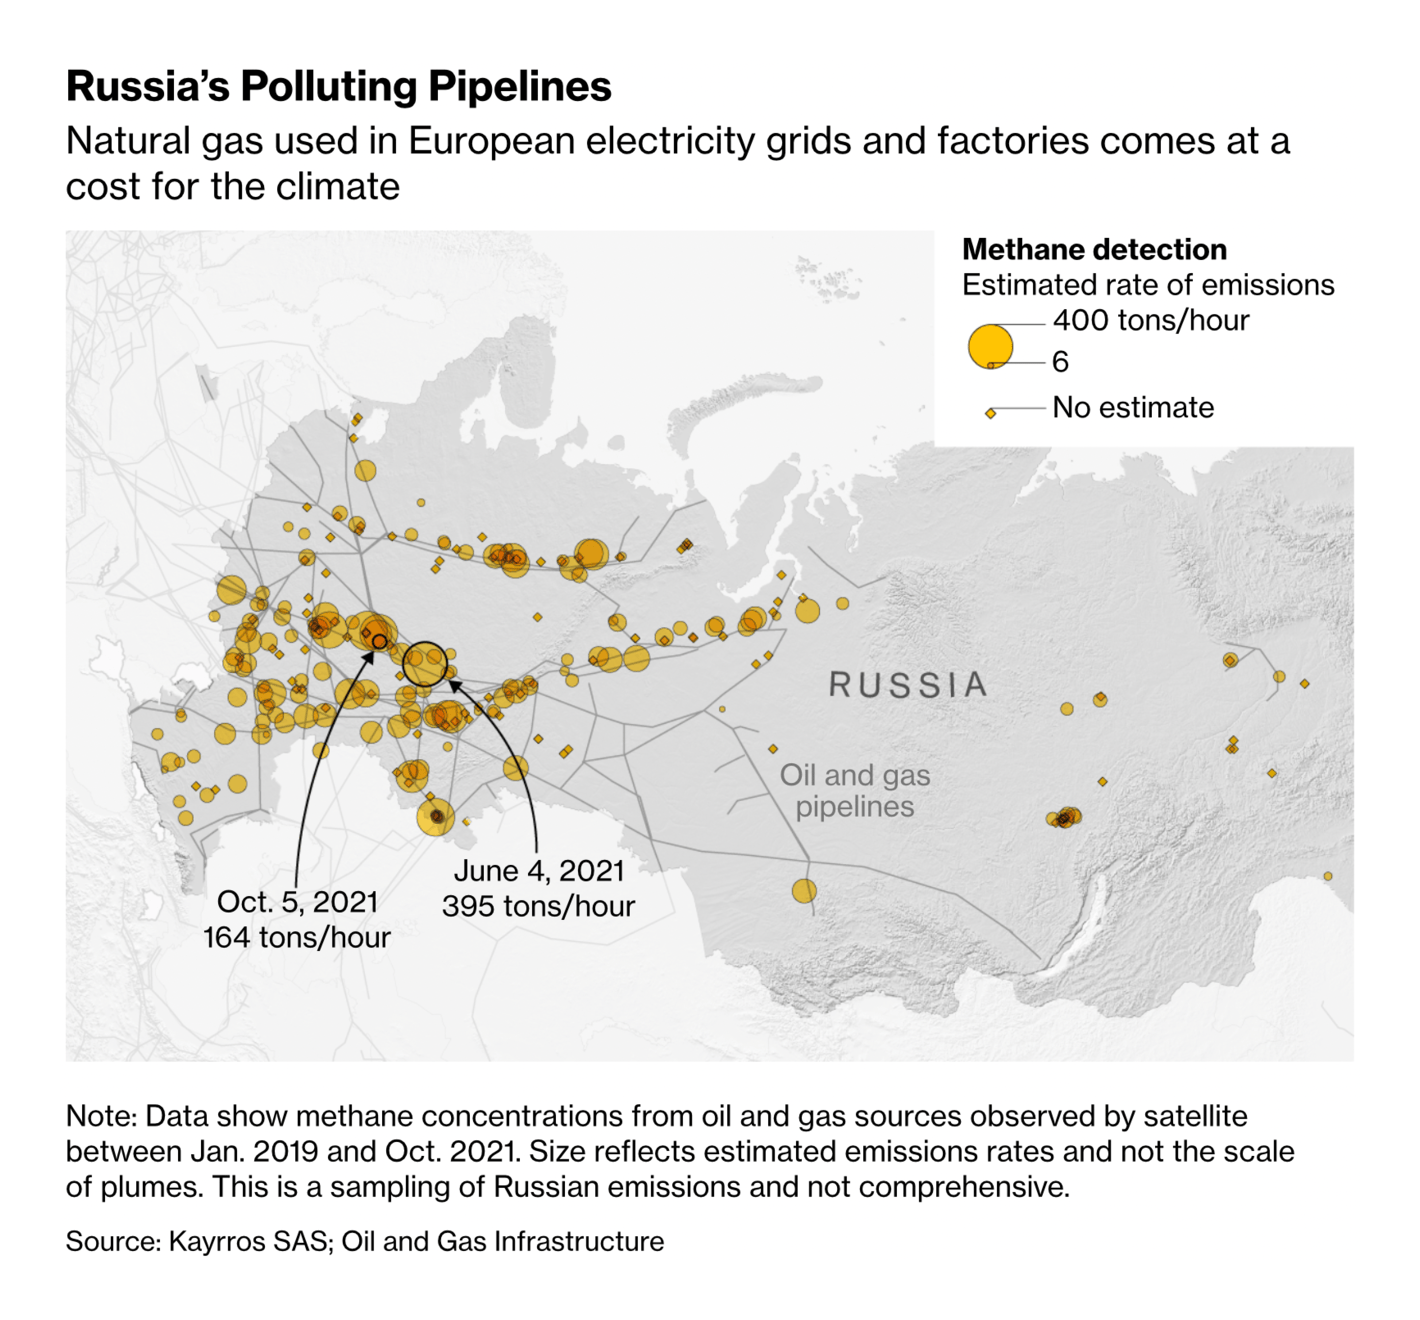
Sorry, your browser doesn't support embedded videos. The Times: The effects of climate change explained: Why we need to act now Gaëlle Sutton: "L'Arctique se réchauffe globalement, et plus particulièrement dans la région des mers de Barents et de Kara. Une carte et deux indicateurs du changement climatique," November 1 (Tweet Les Echos: COP26 : 12 graphiques pour comprendre les conséquences du réchauffement climatique ZDF: ZDFheute-KlimaRadar Bloomberg: Unlimited Sand and Money Still Won’t Save the Hamptons Despite all this, we haven't collectively given up our dirtiest energy habits:
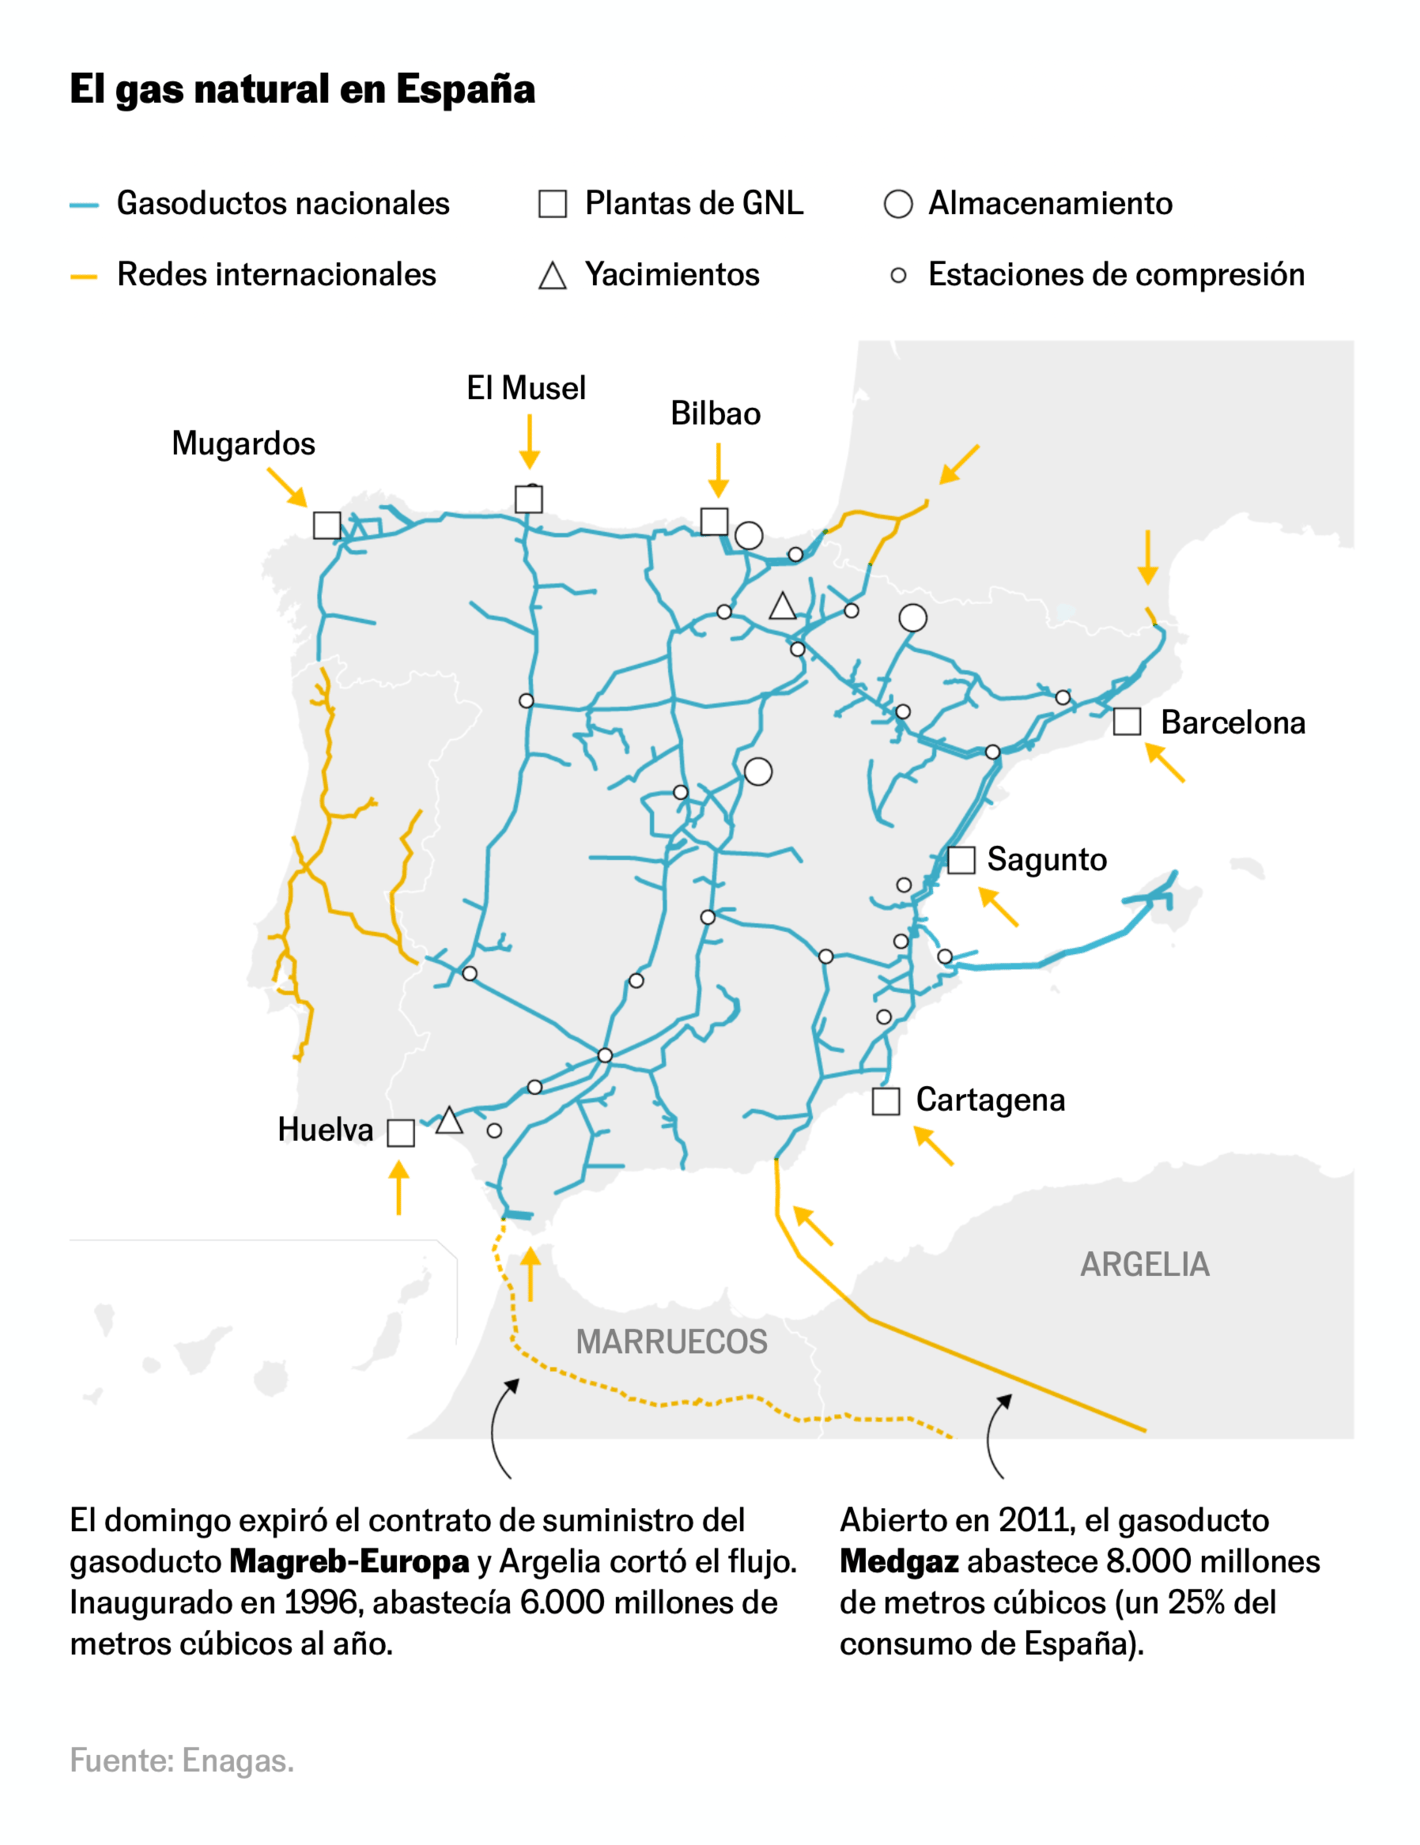
Bloomberg: Russia’s Dirty Gas Is Keeping Europe From Freezing Over El País: España aumentará las importaciones por metaneros para cubrir el cierre del gasoducto que atraviesa Marruecos But far more charts this week focused on what the solutions could be — from efficient transit to carbon pricing to electoral change:
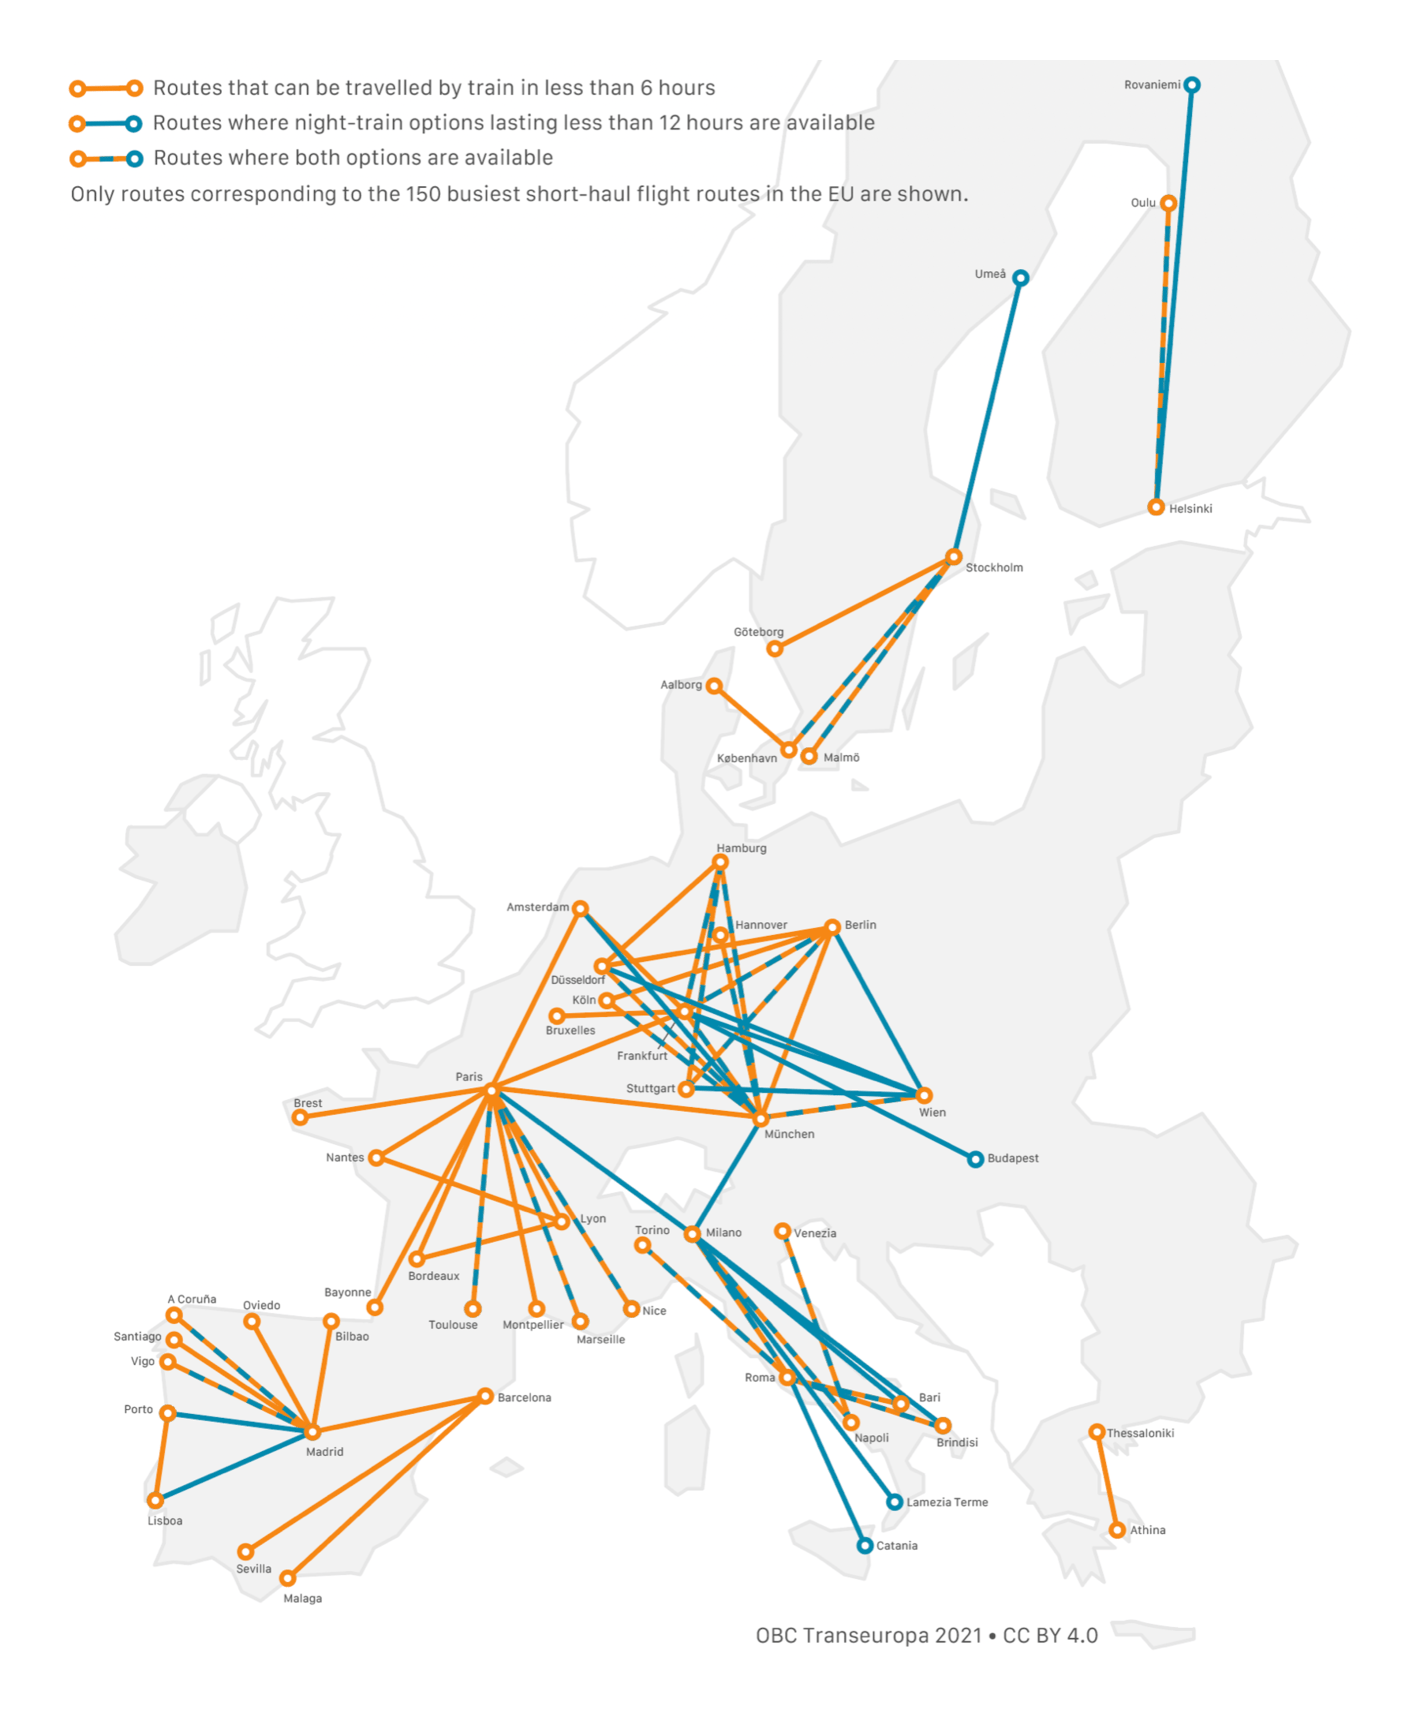
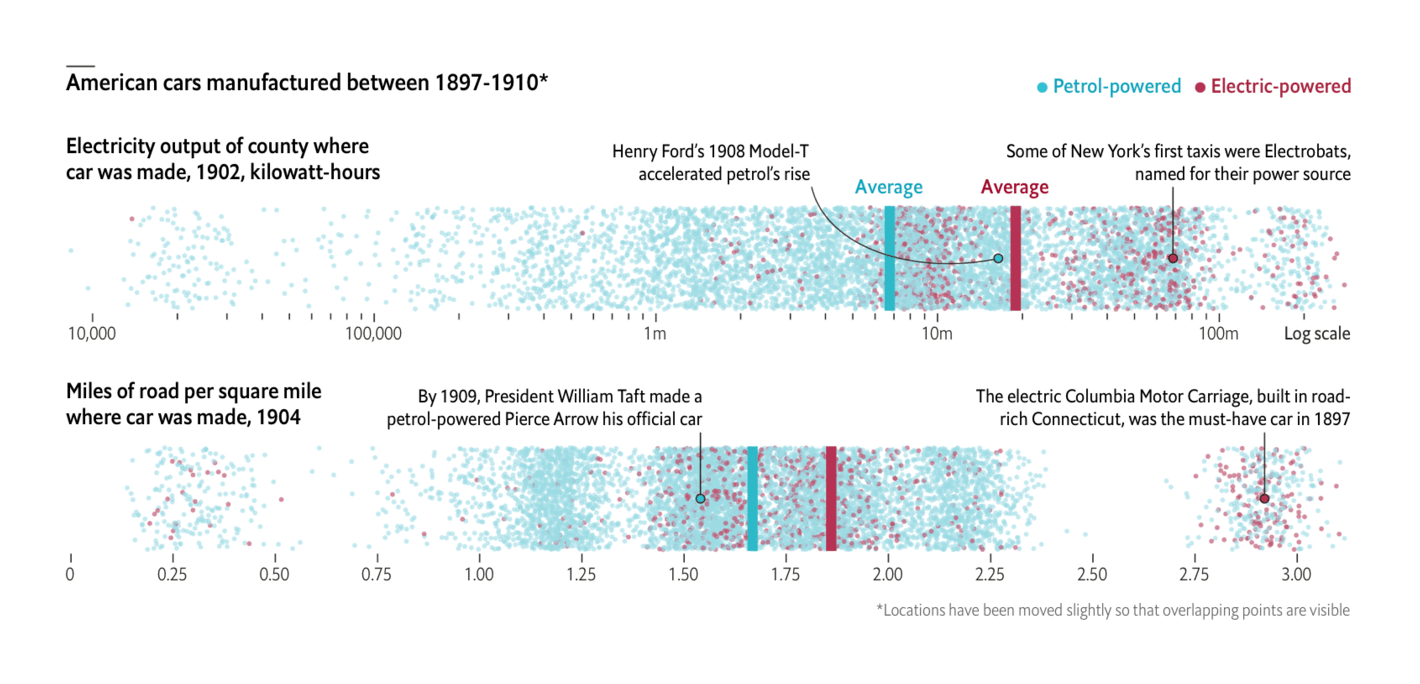
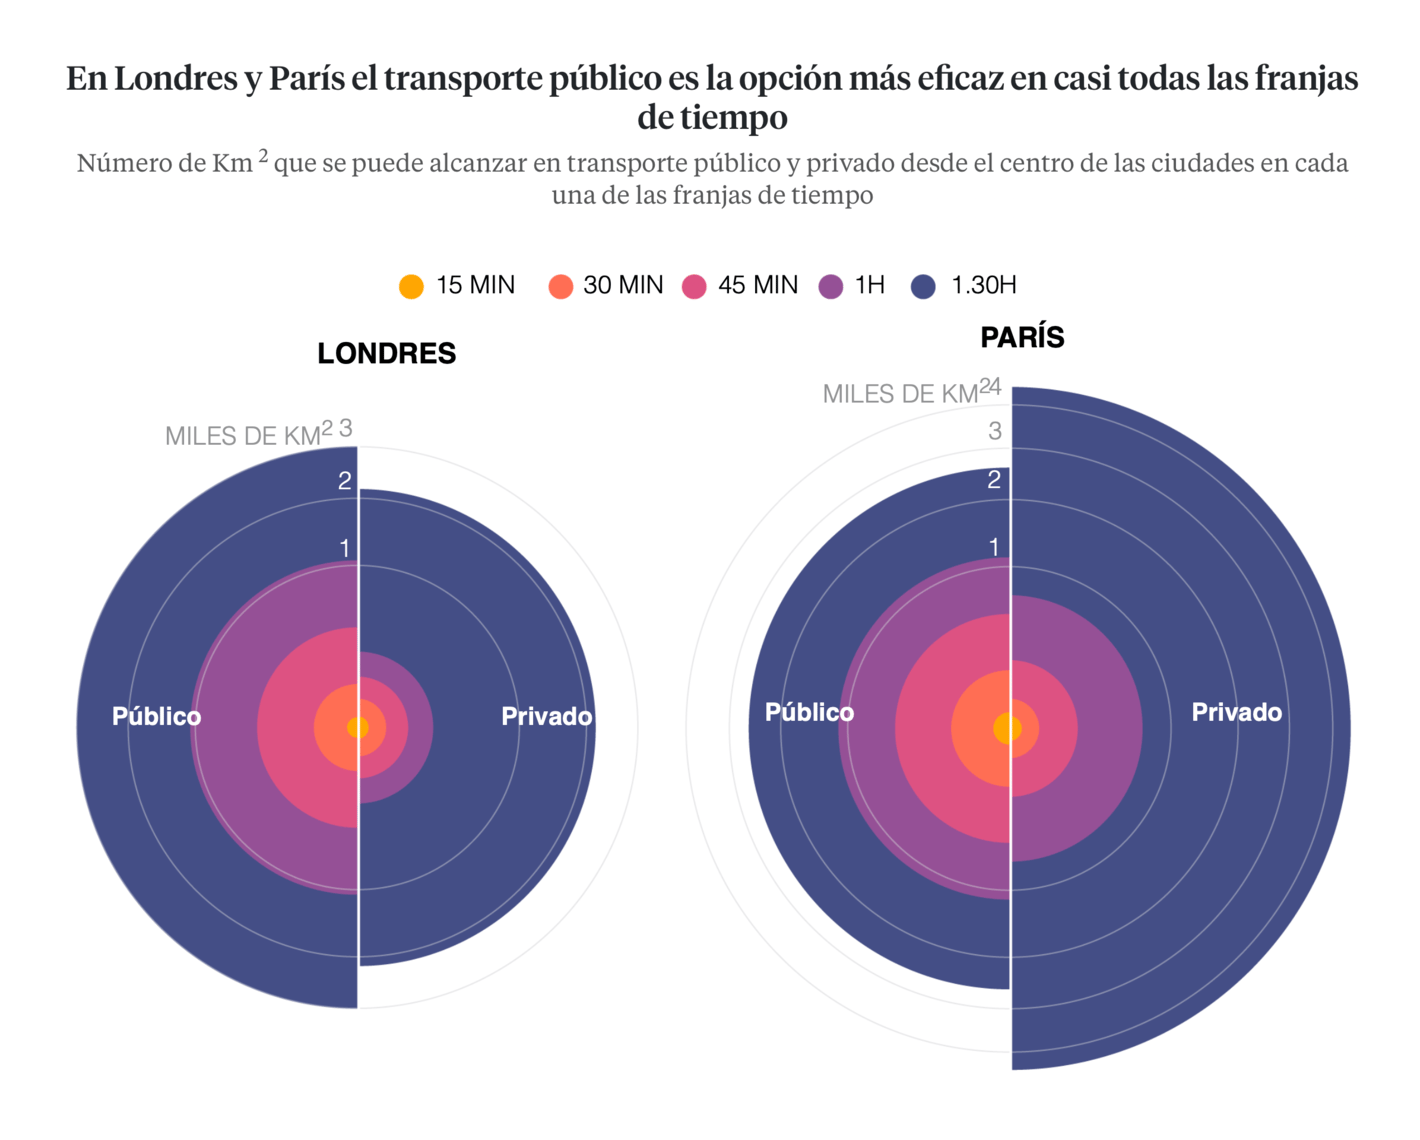
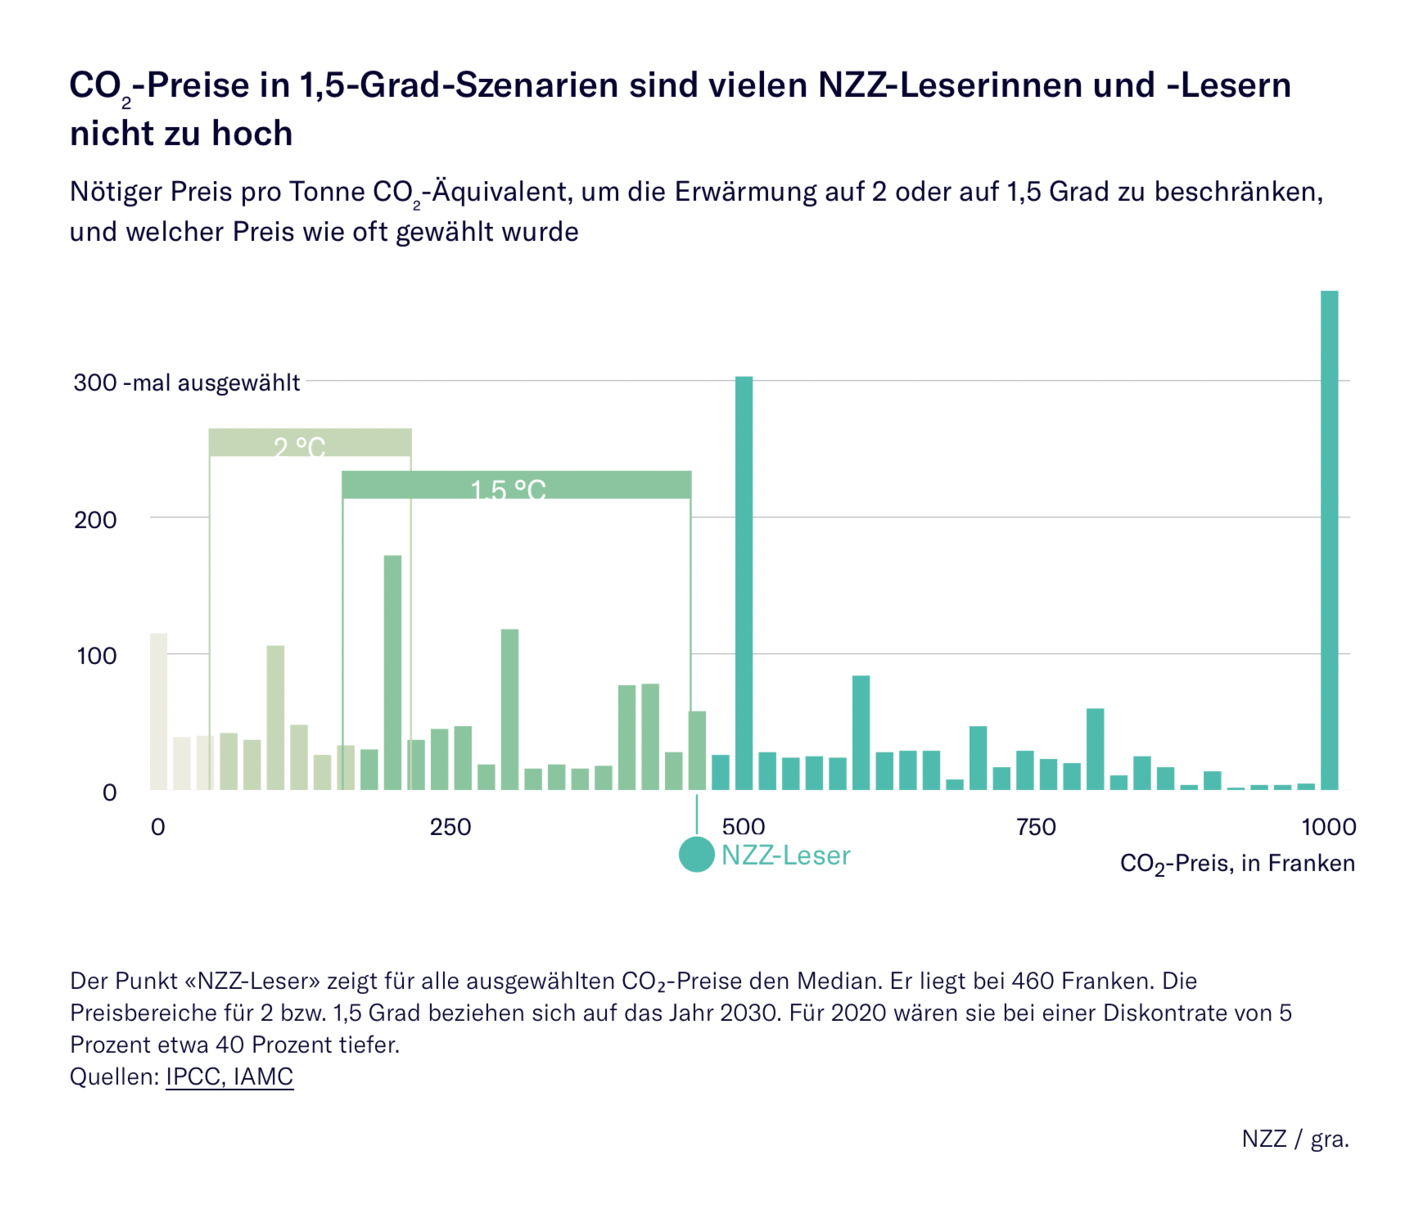
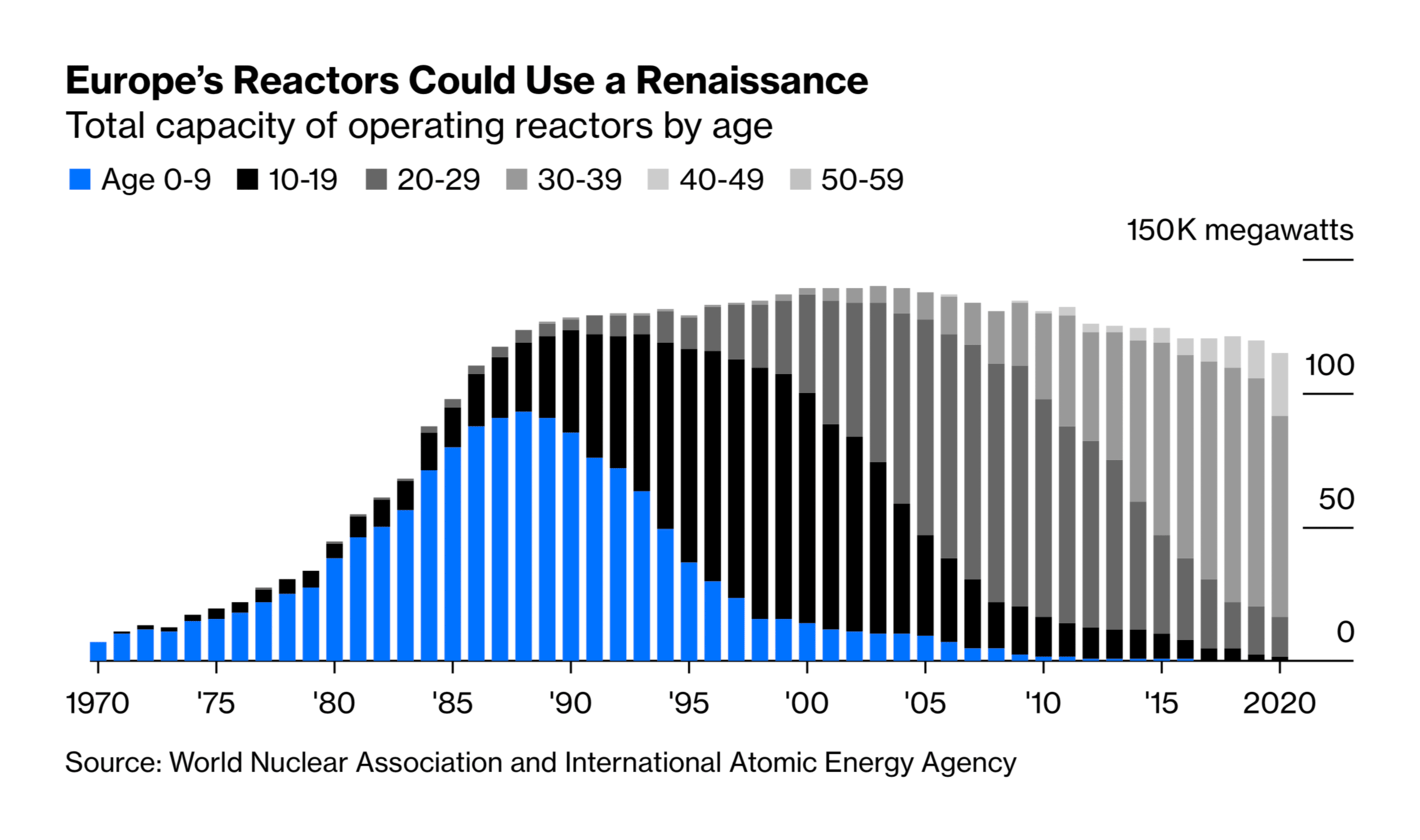
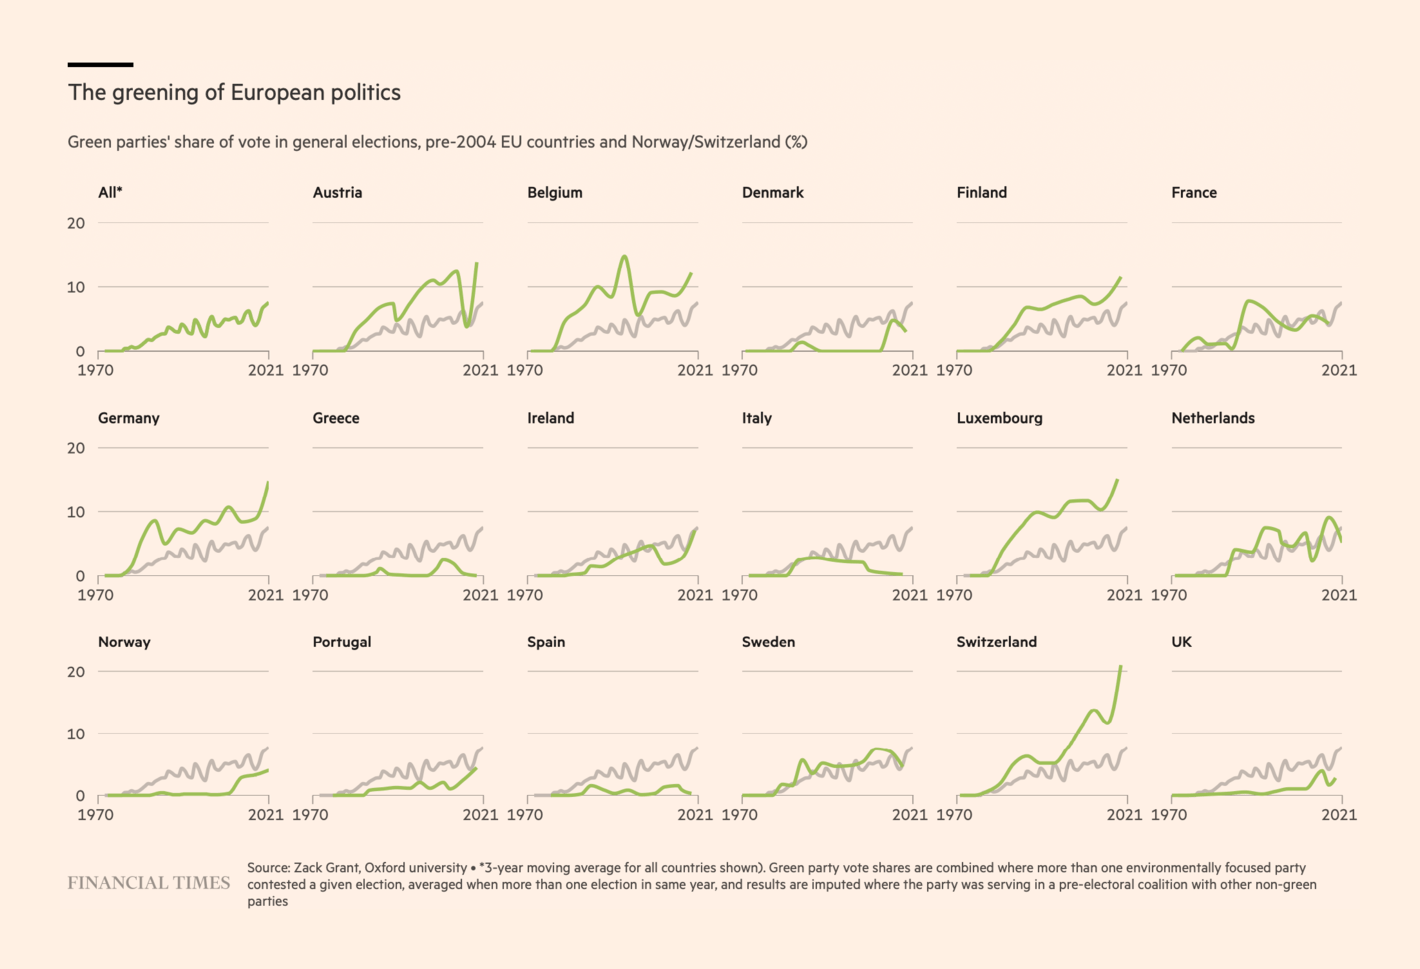
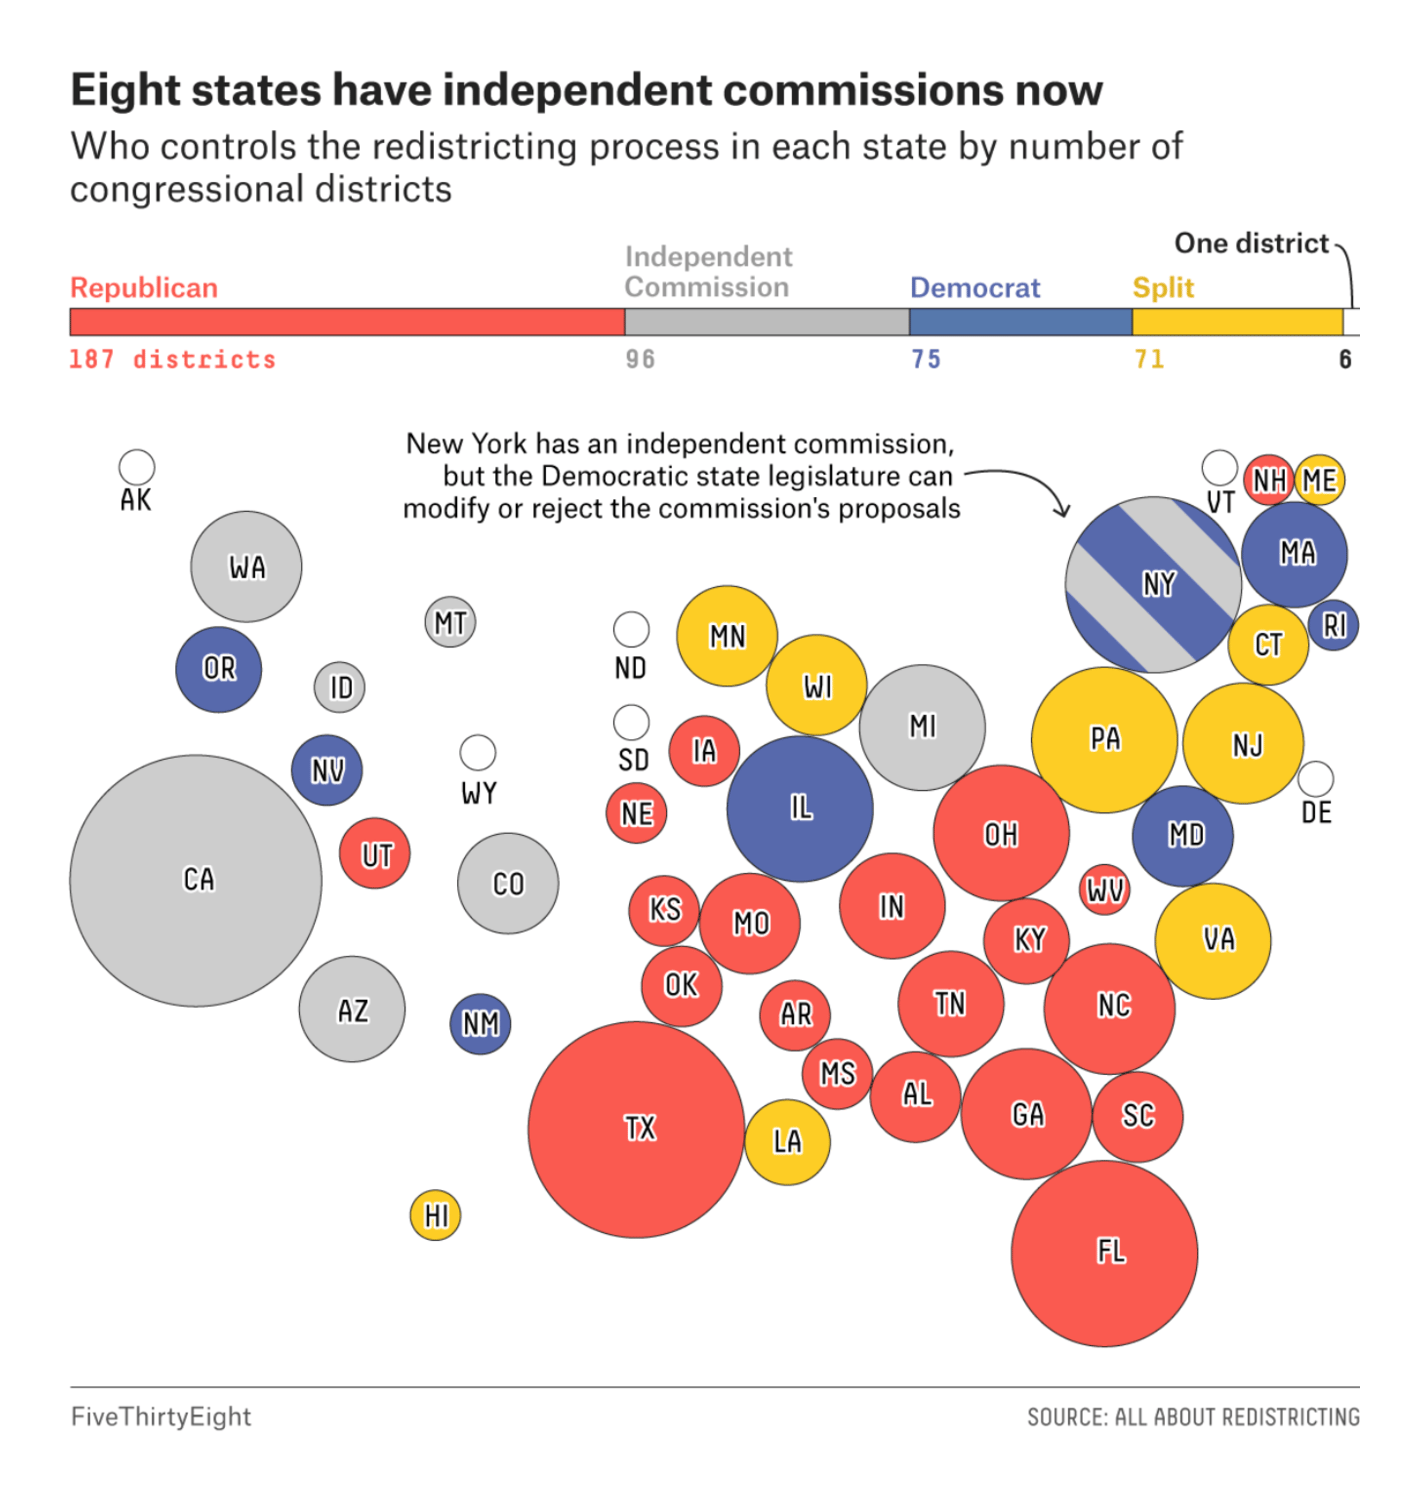
OBC Transeuropa: More trains, fewer emissions The Economist: A new study argues that insufficient infrastructure doomed the first electric cars La Vanguardia: El coche sigue siendo el medio más eficaz en las grandes ciudades españolas Neue Zürcher Zeitung: Viele NZZ-Leser würden über 400 Franken pro Tonne CO2 bezahlen. Damit wäre das 1,5-Grad-Ziel zu schaffen Bloomberg: Abandoning Nuclear Power Would Be Europe’s Biggest Climate Mistake Financial Times: COP26: how green politics went mainstream In politics, the U.S. congressional map is still in flux:
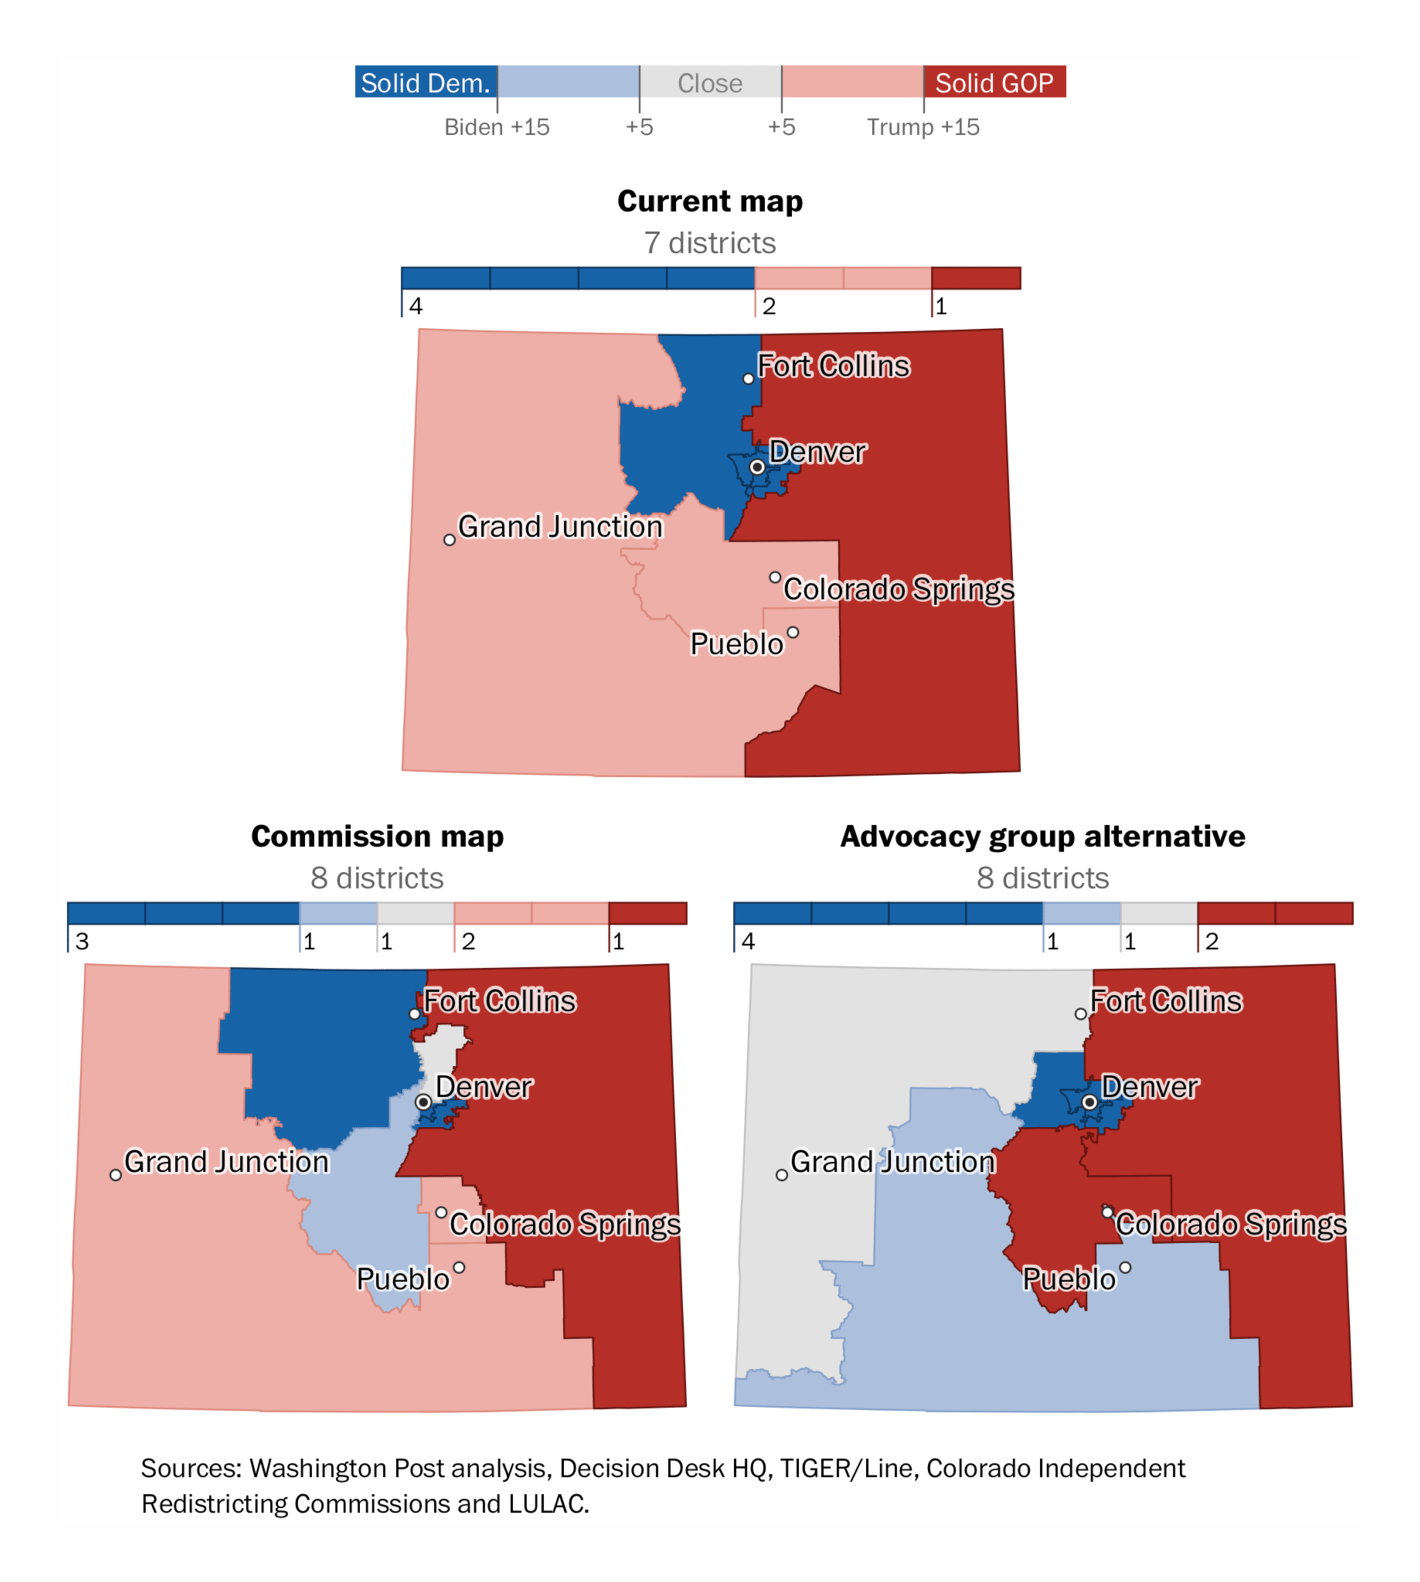
FiveThirtyEight: Americans Don’t Trust Their Congressional Maps To Be Drawn Fairly. Can Anything Change That? The Washington Post: Democrats backed a commission to draw fair House lines in Colorado. Now they worry they gave up their power And a major spending bill is still stalled in the Senate:
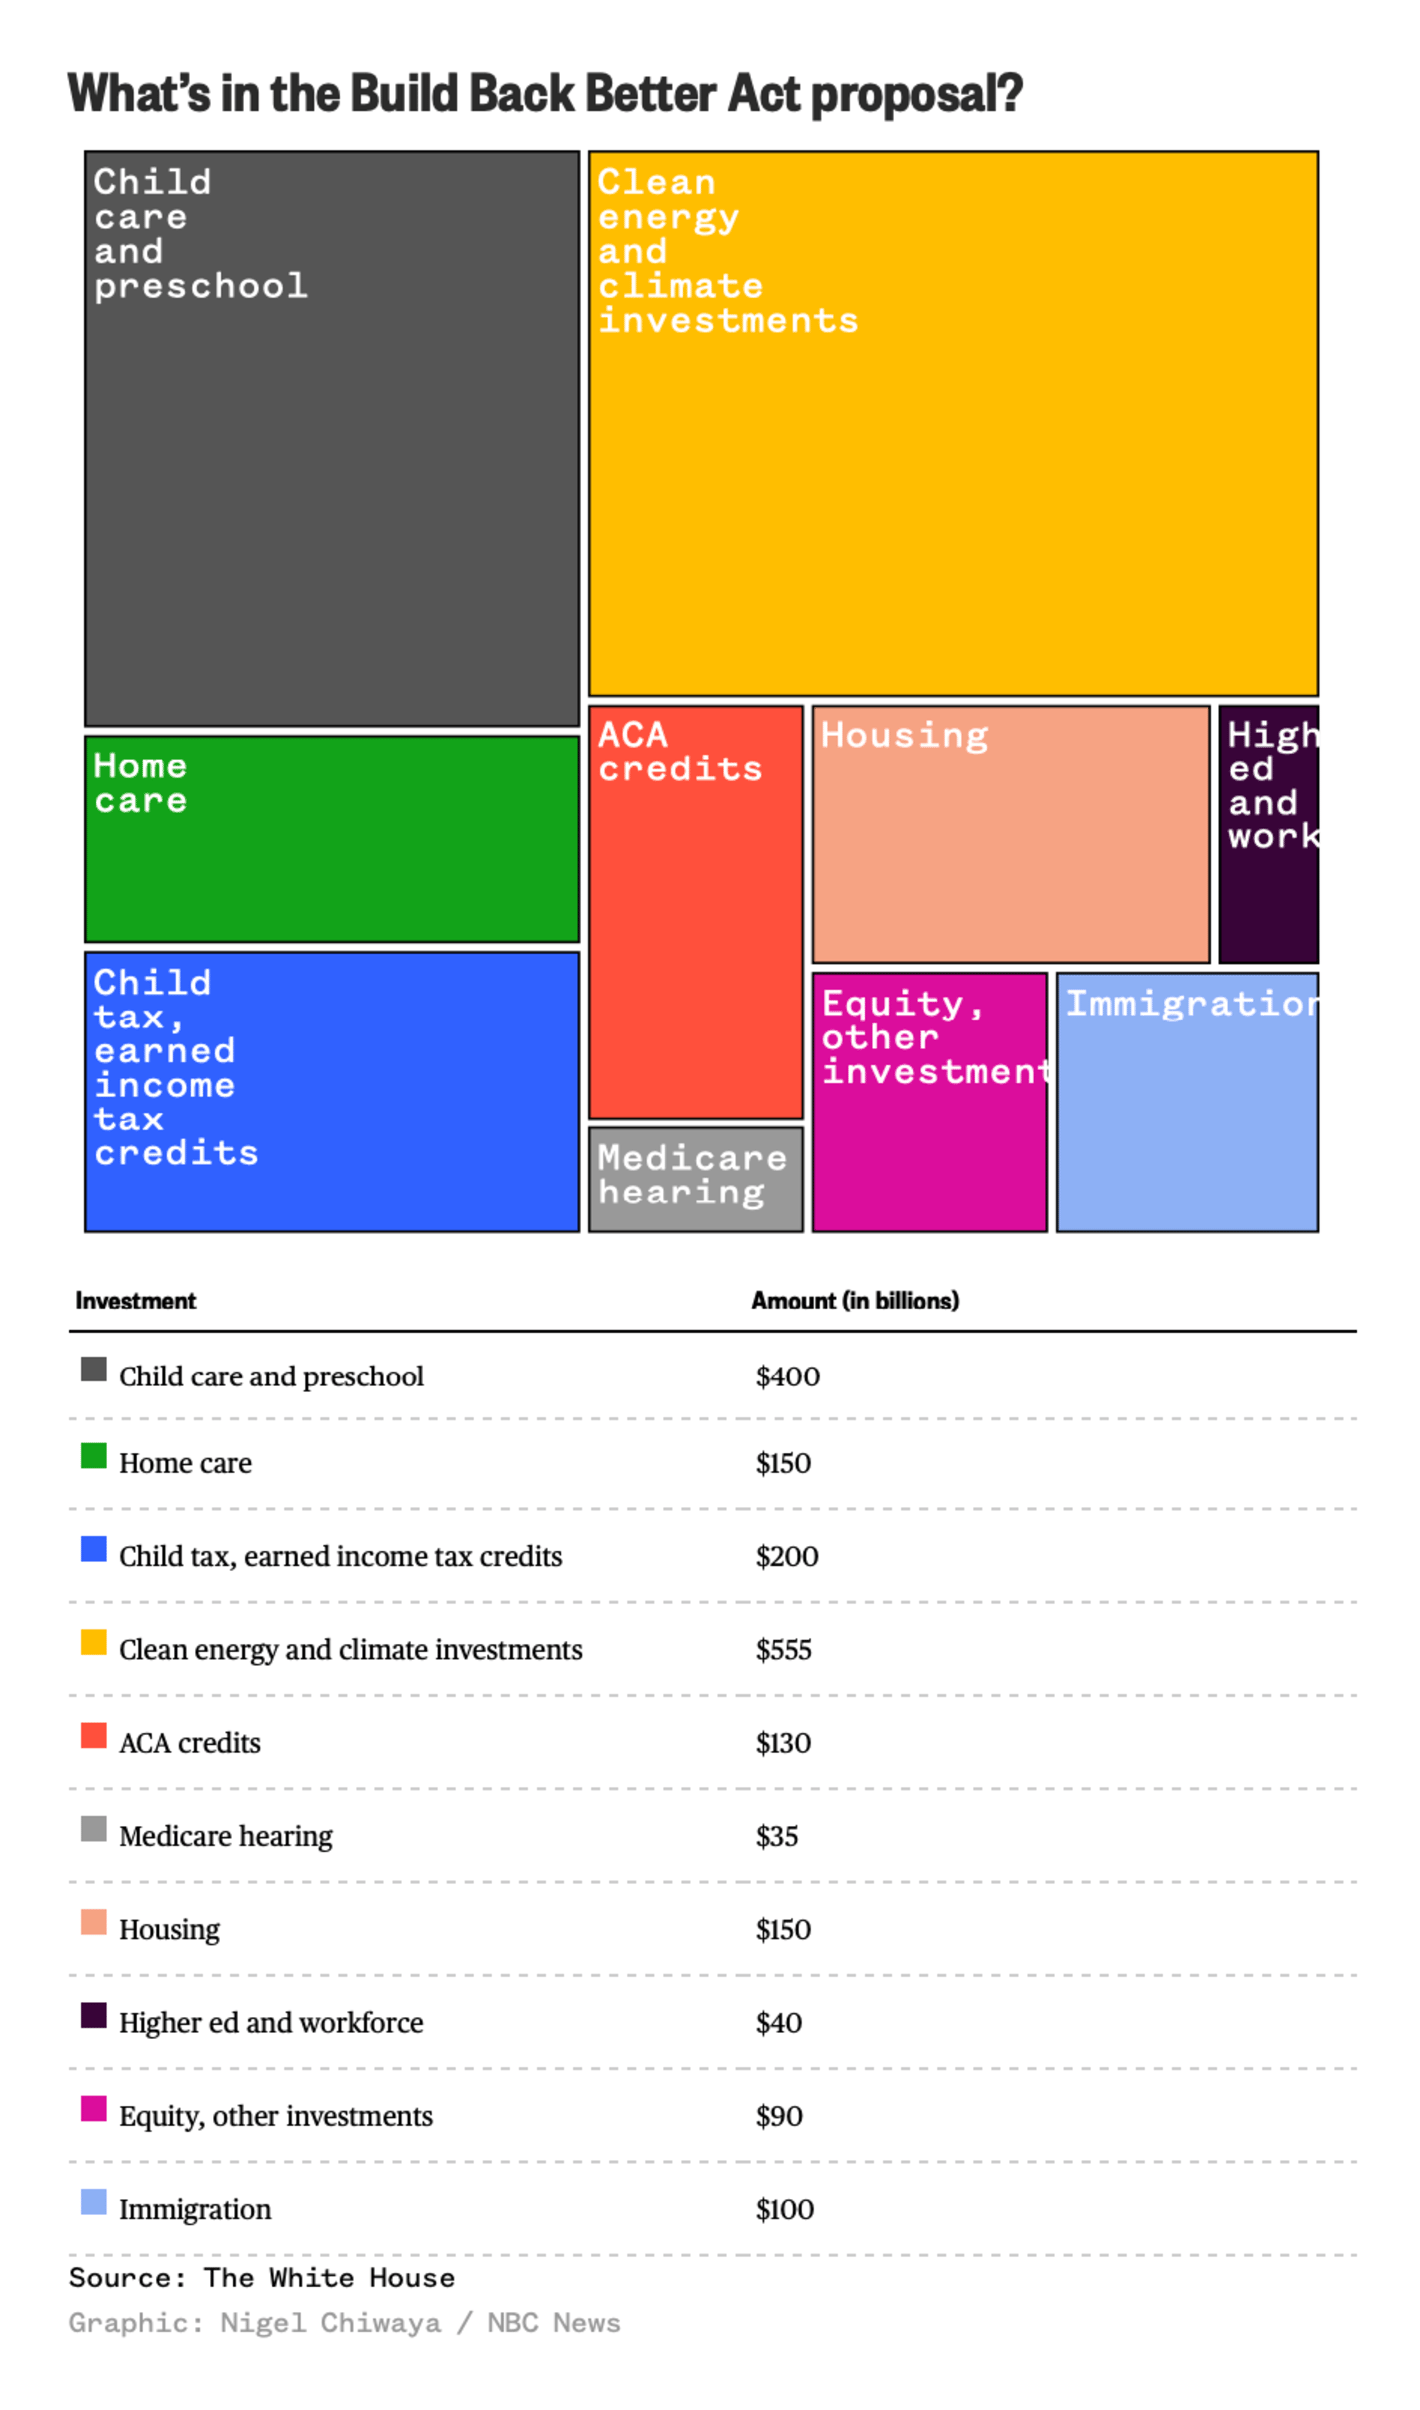
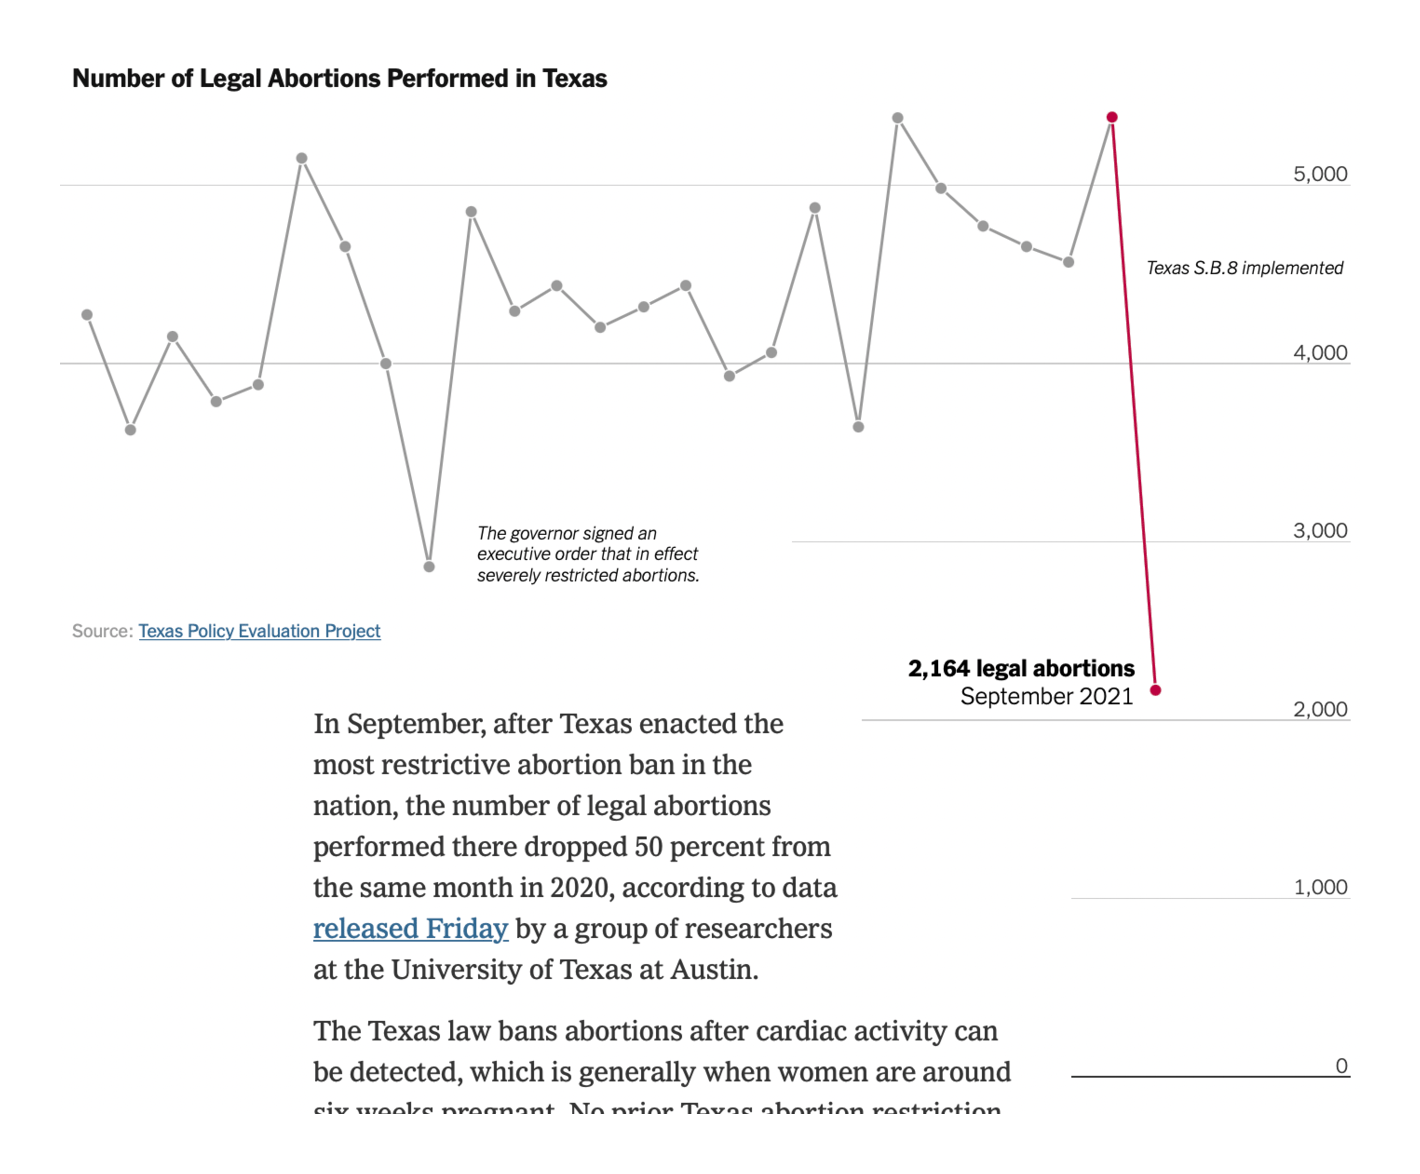
The Washington Post: Here’s what is in the $1.75 trillion Biden budget plan NBC News: Biden's Build Back Better bill: What made it in and what was stripped out The U.S. Supreme Court is hearing arguments this week on the structure of a restrictive Texas abortion law:
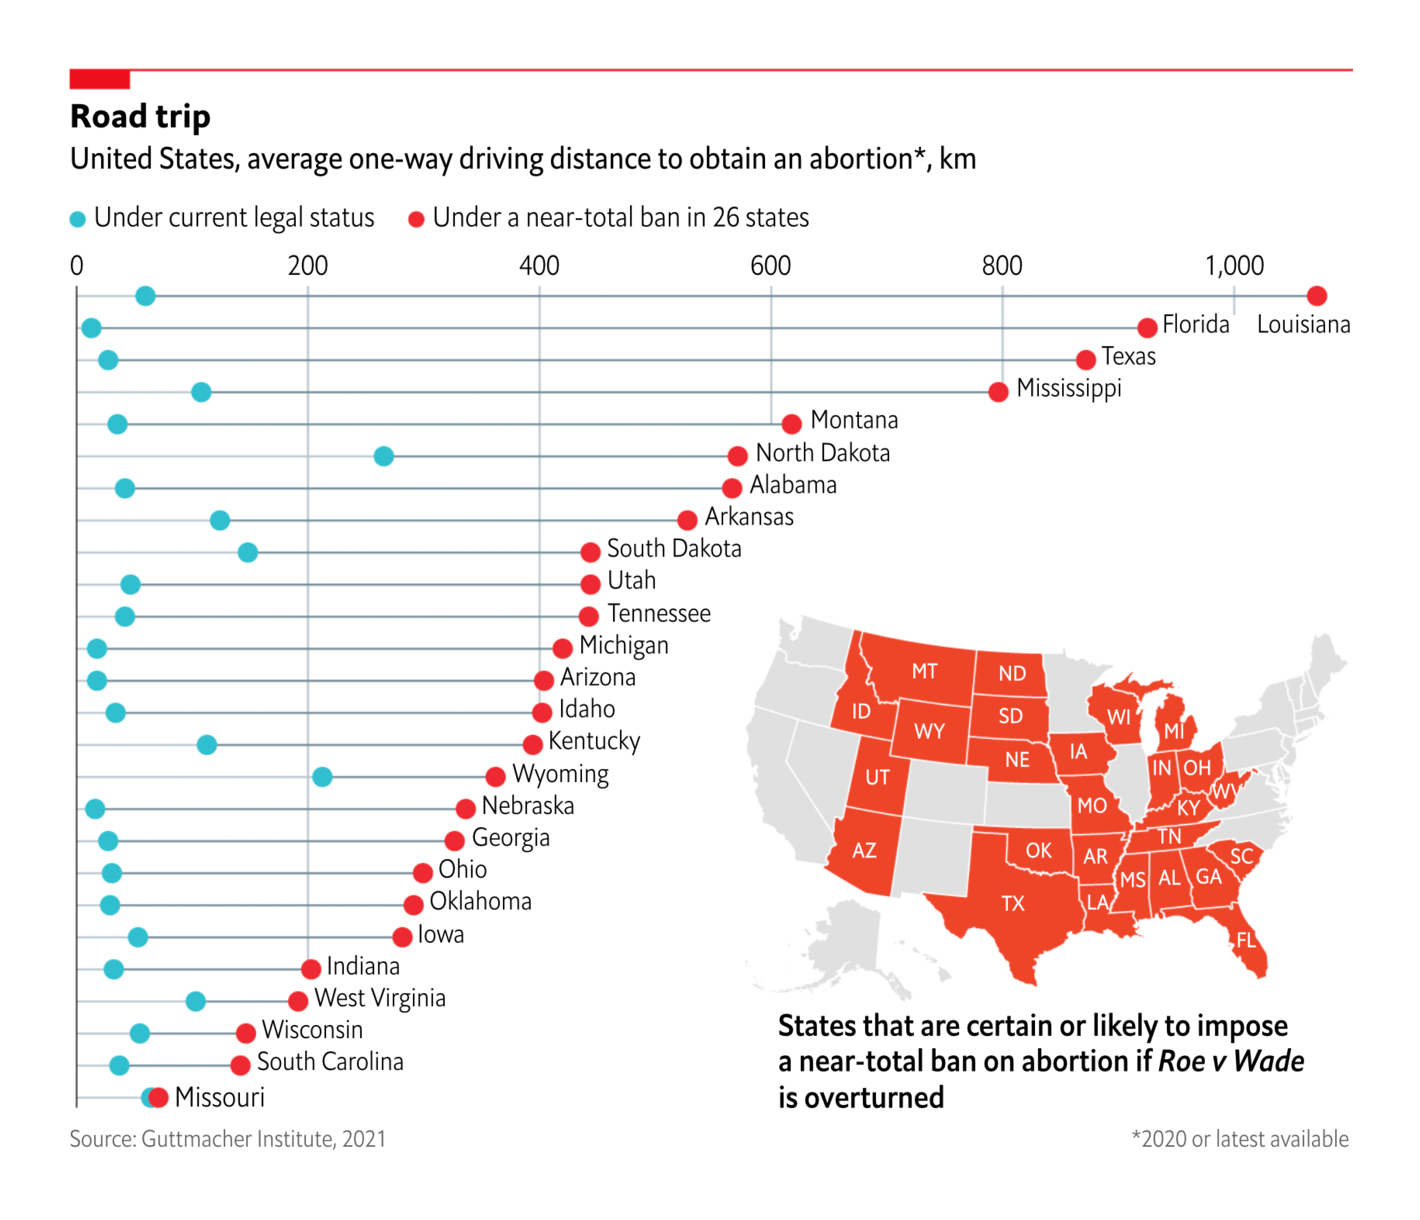
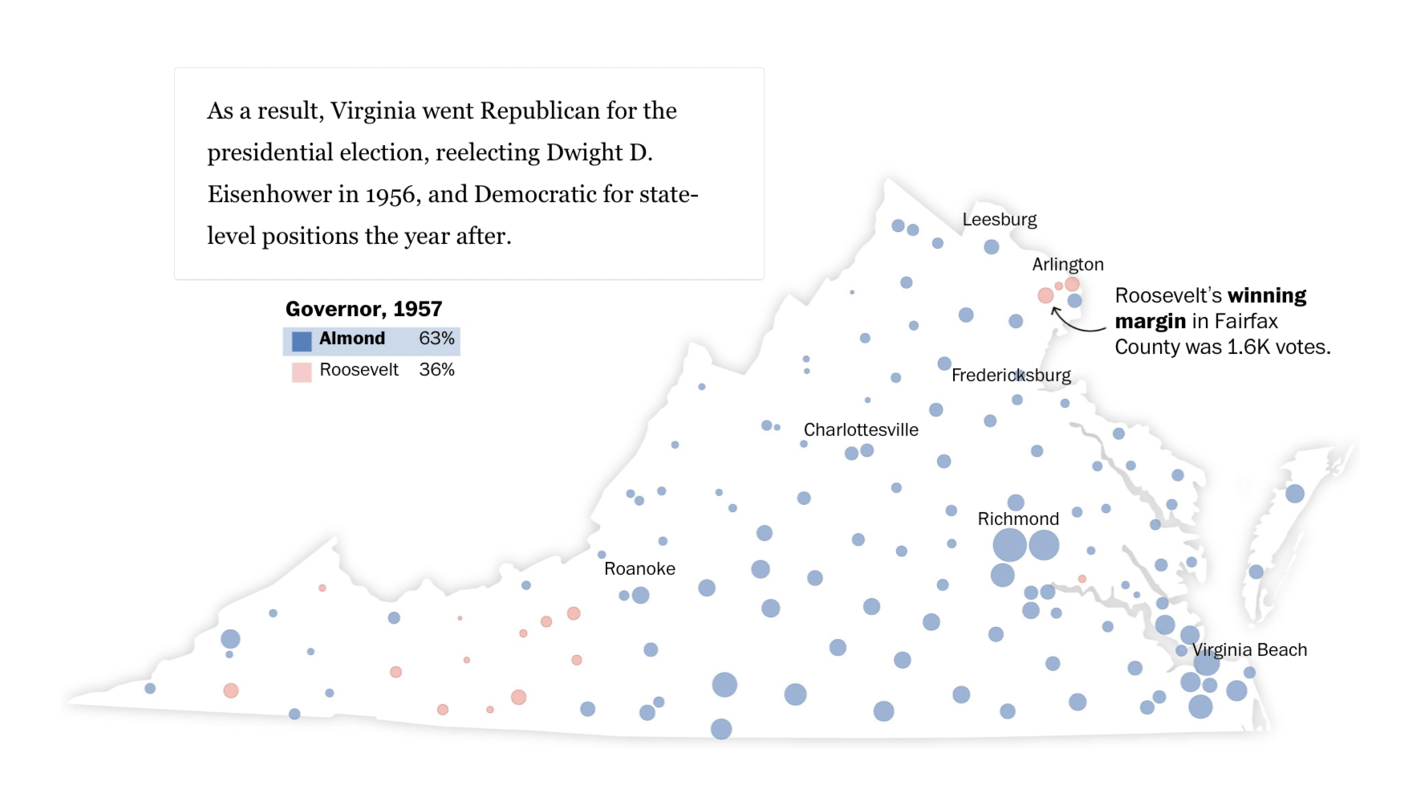
The New York Times: Abortions Fell by Half in Month After New Texas Law The Economist: Abortion restrictions will push many American women across state lines And other political charts looked at partisan history in the U.S. and budget plans in U.K.:
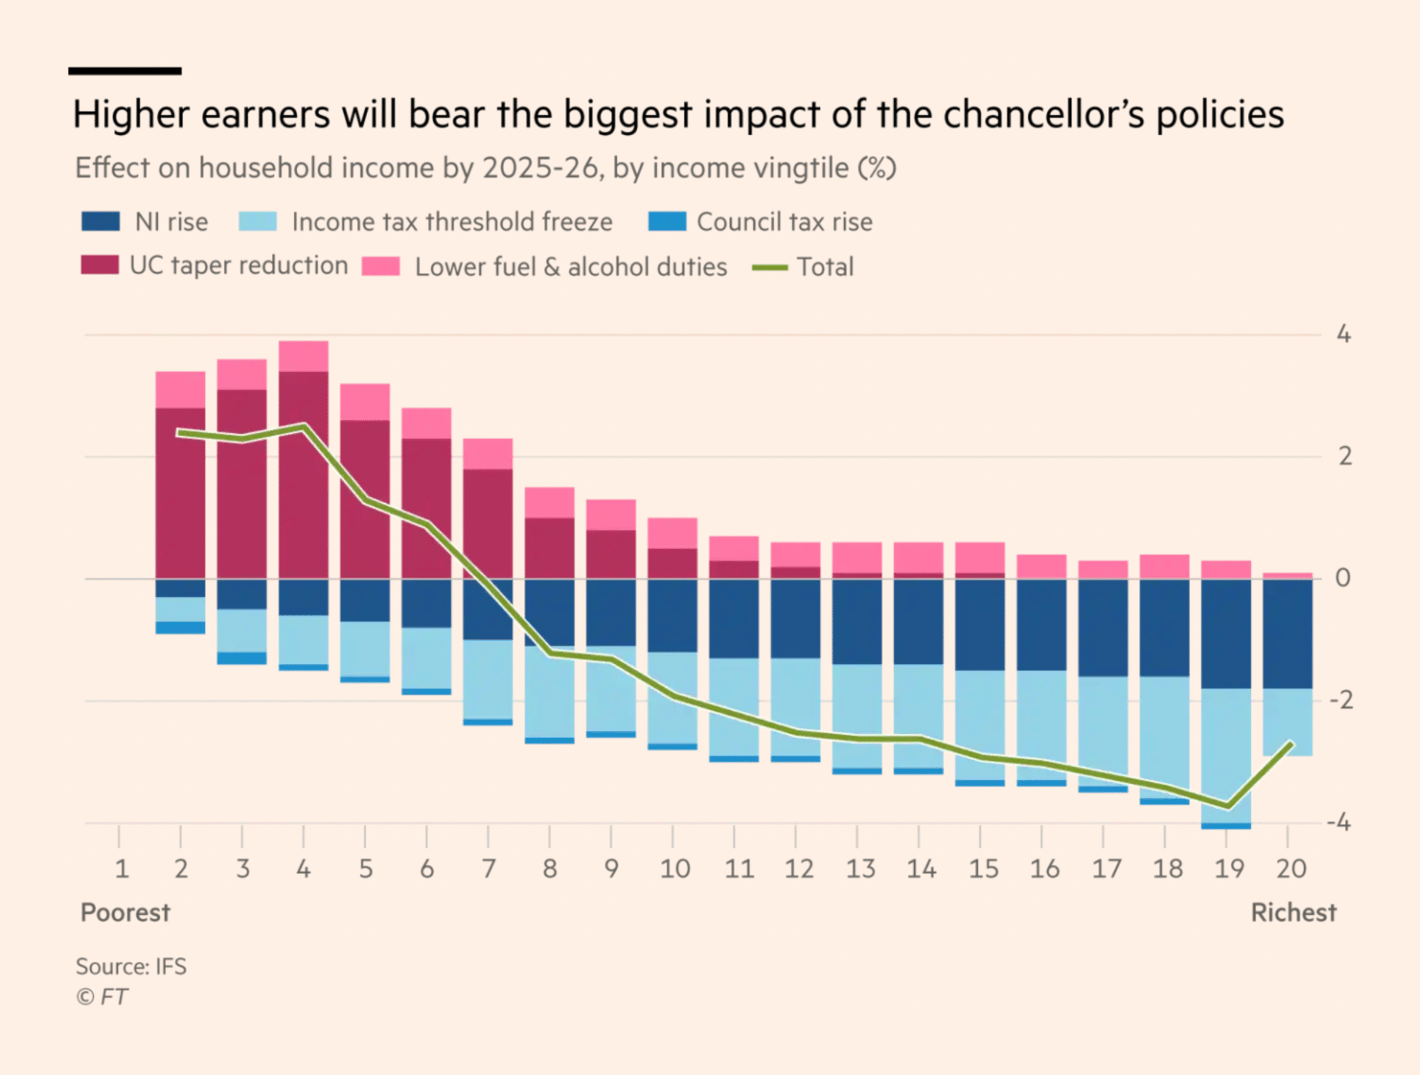
The Washington Post: Before recent Democratic gains, Virginia went from blue to red and back again Financial Times: Budget will leave millions worse off next year, studies find The breakout topic of the week was rainforests:
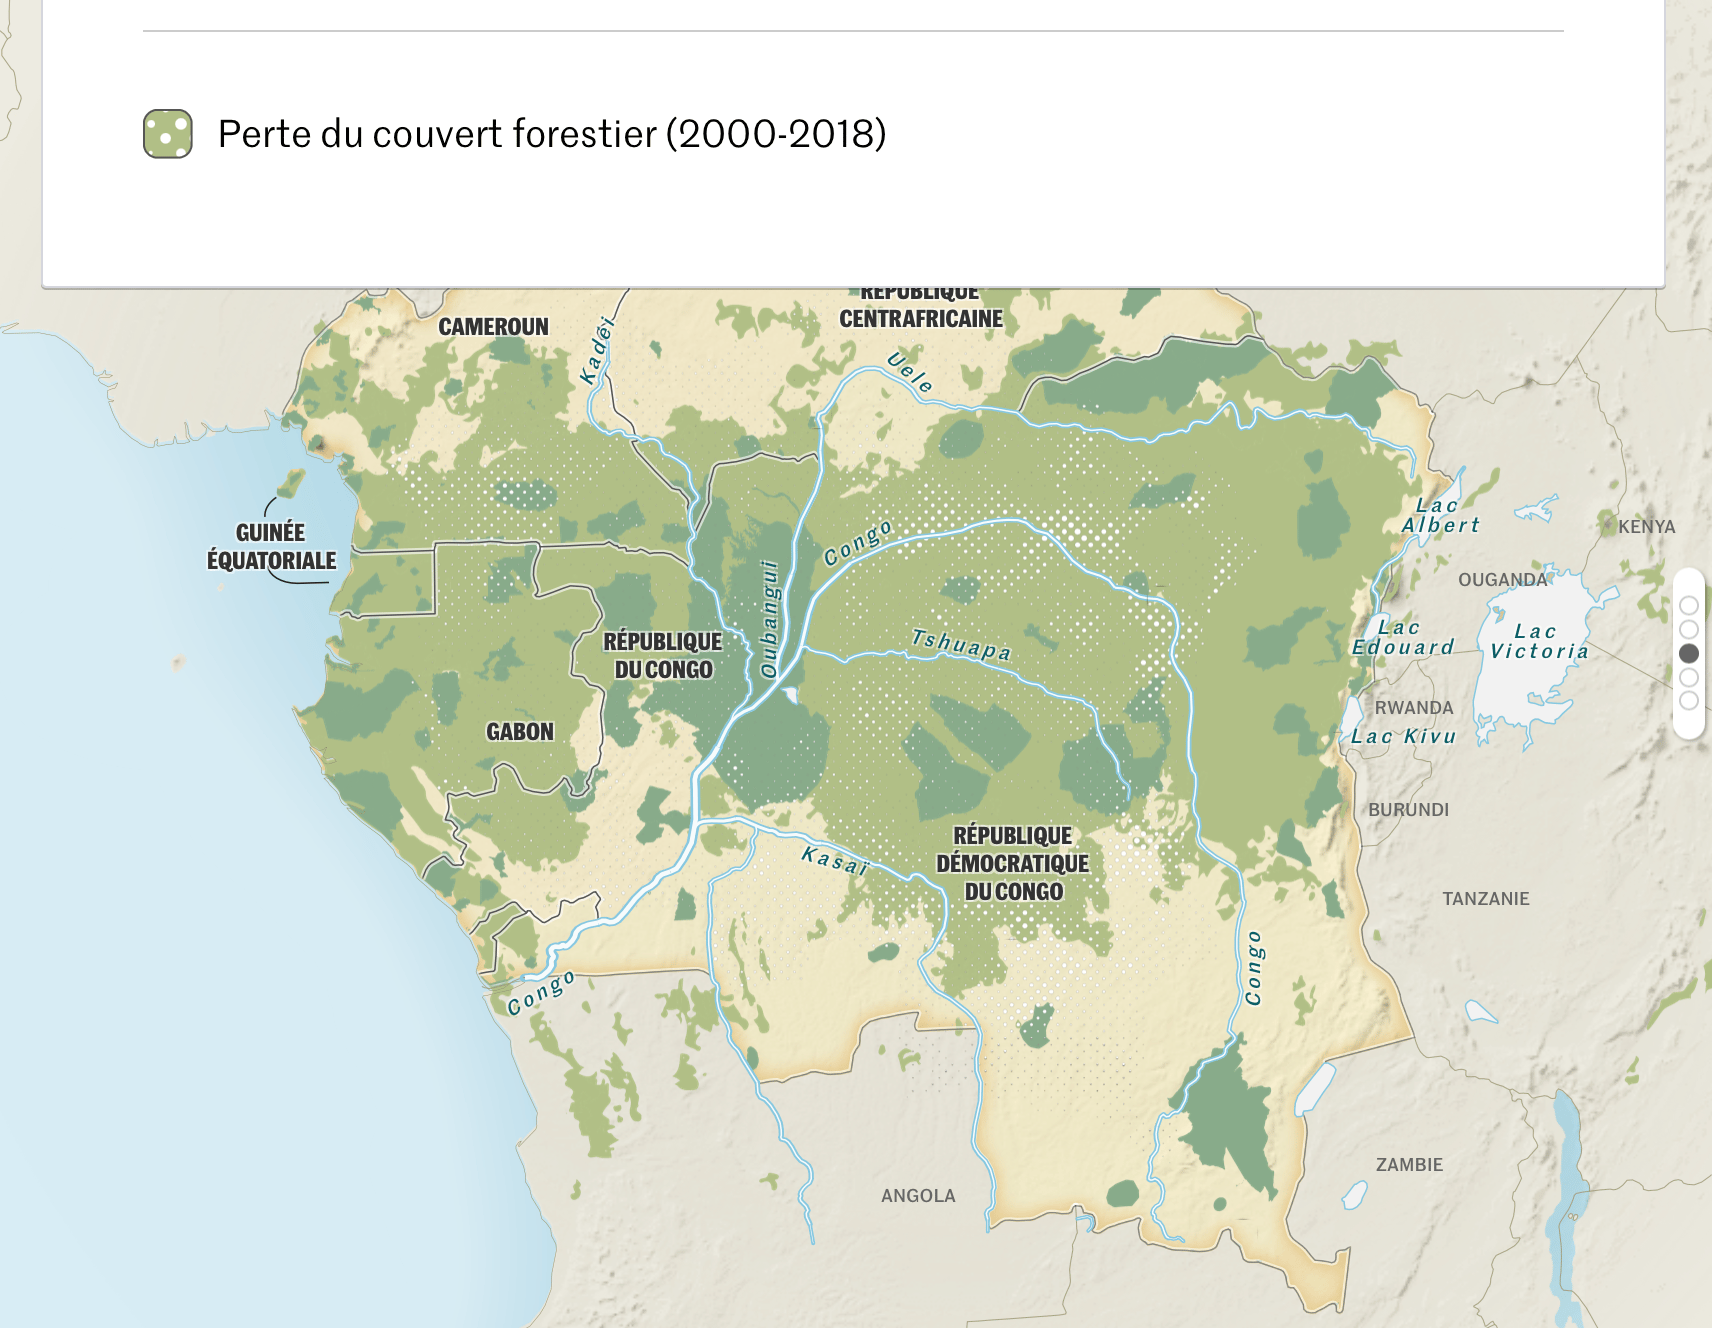
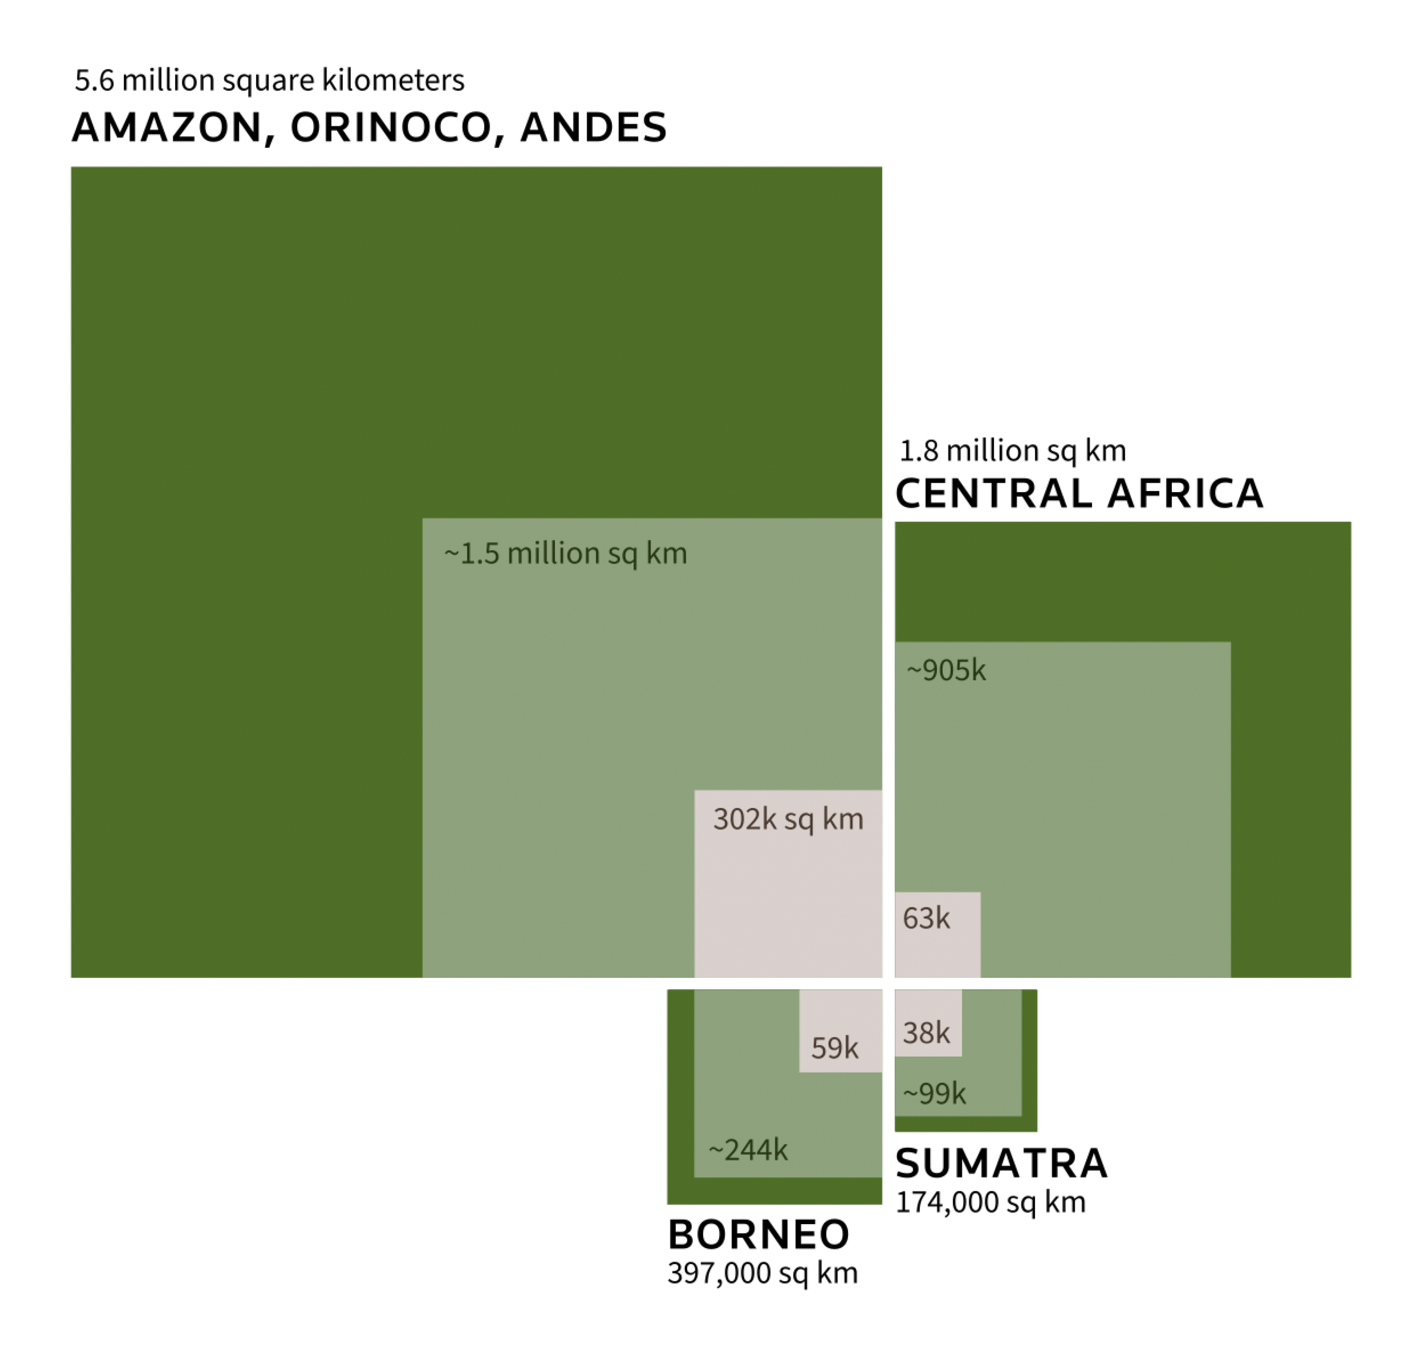
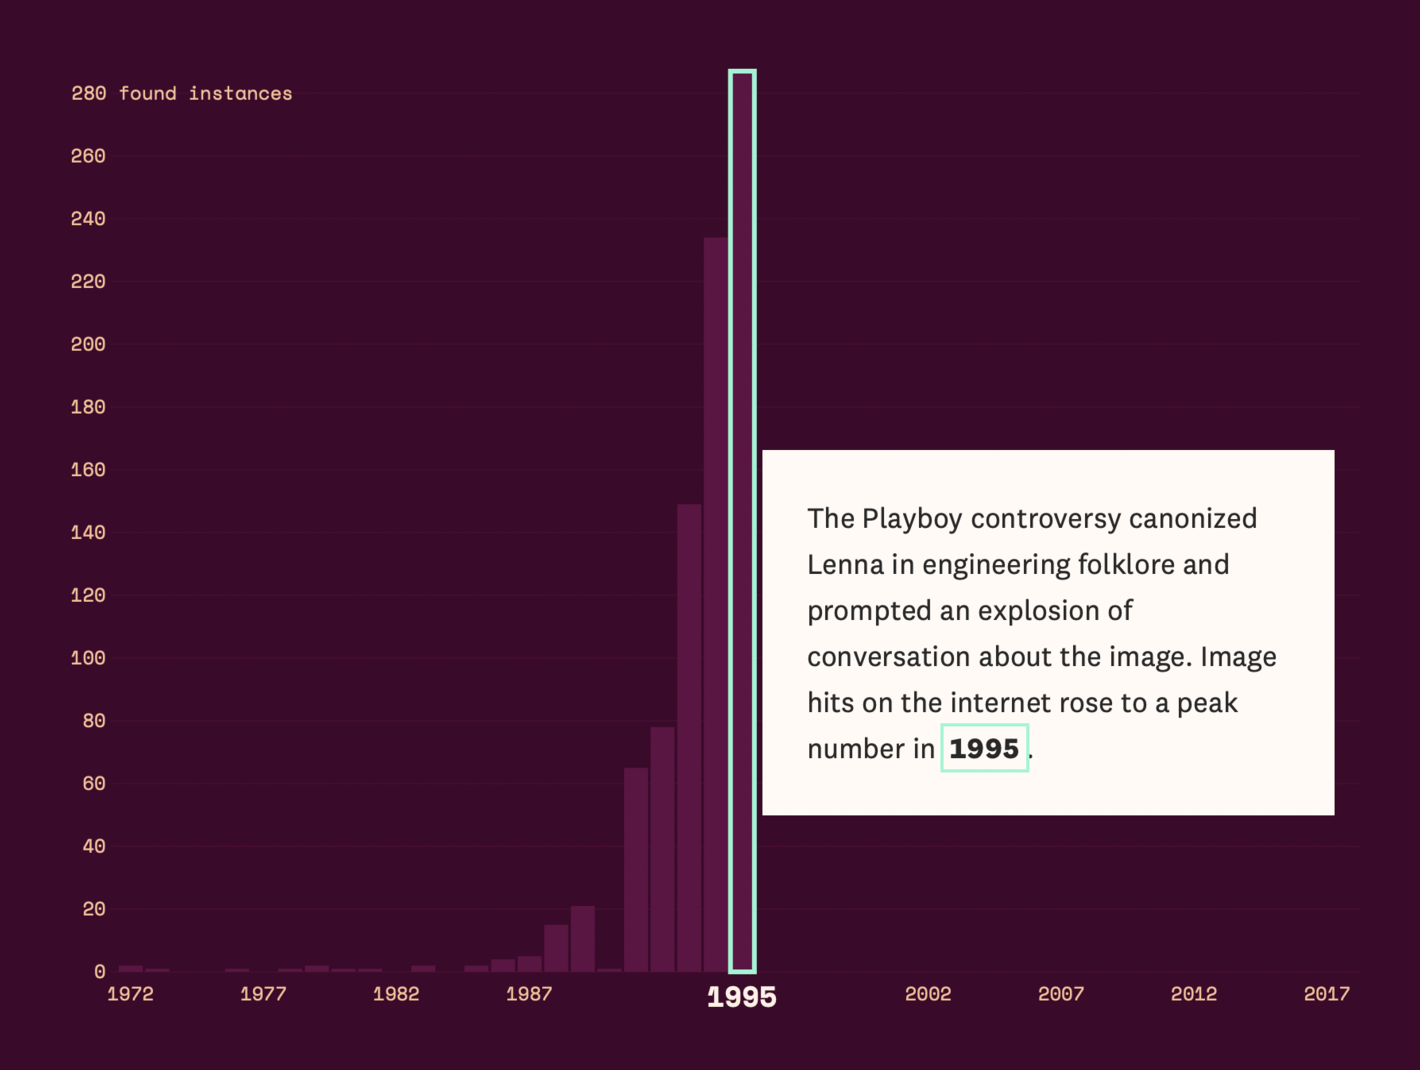
Le Monde: Le bassin du Congo, entre préservation et exploitation Reuters: Vanishing Tropical Rainforests And we also had two visual stories on the internet — one very topical, one (relatively) timeless:
The Washington Post: How Facebook shapes your feed , October 26 The Pudding: Can Data Die? Miscellaneous topics included international affairs, manufacturing, and more:
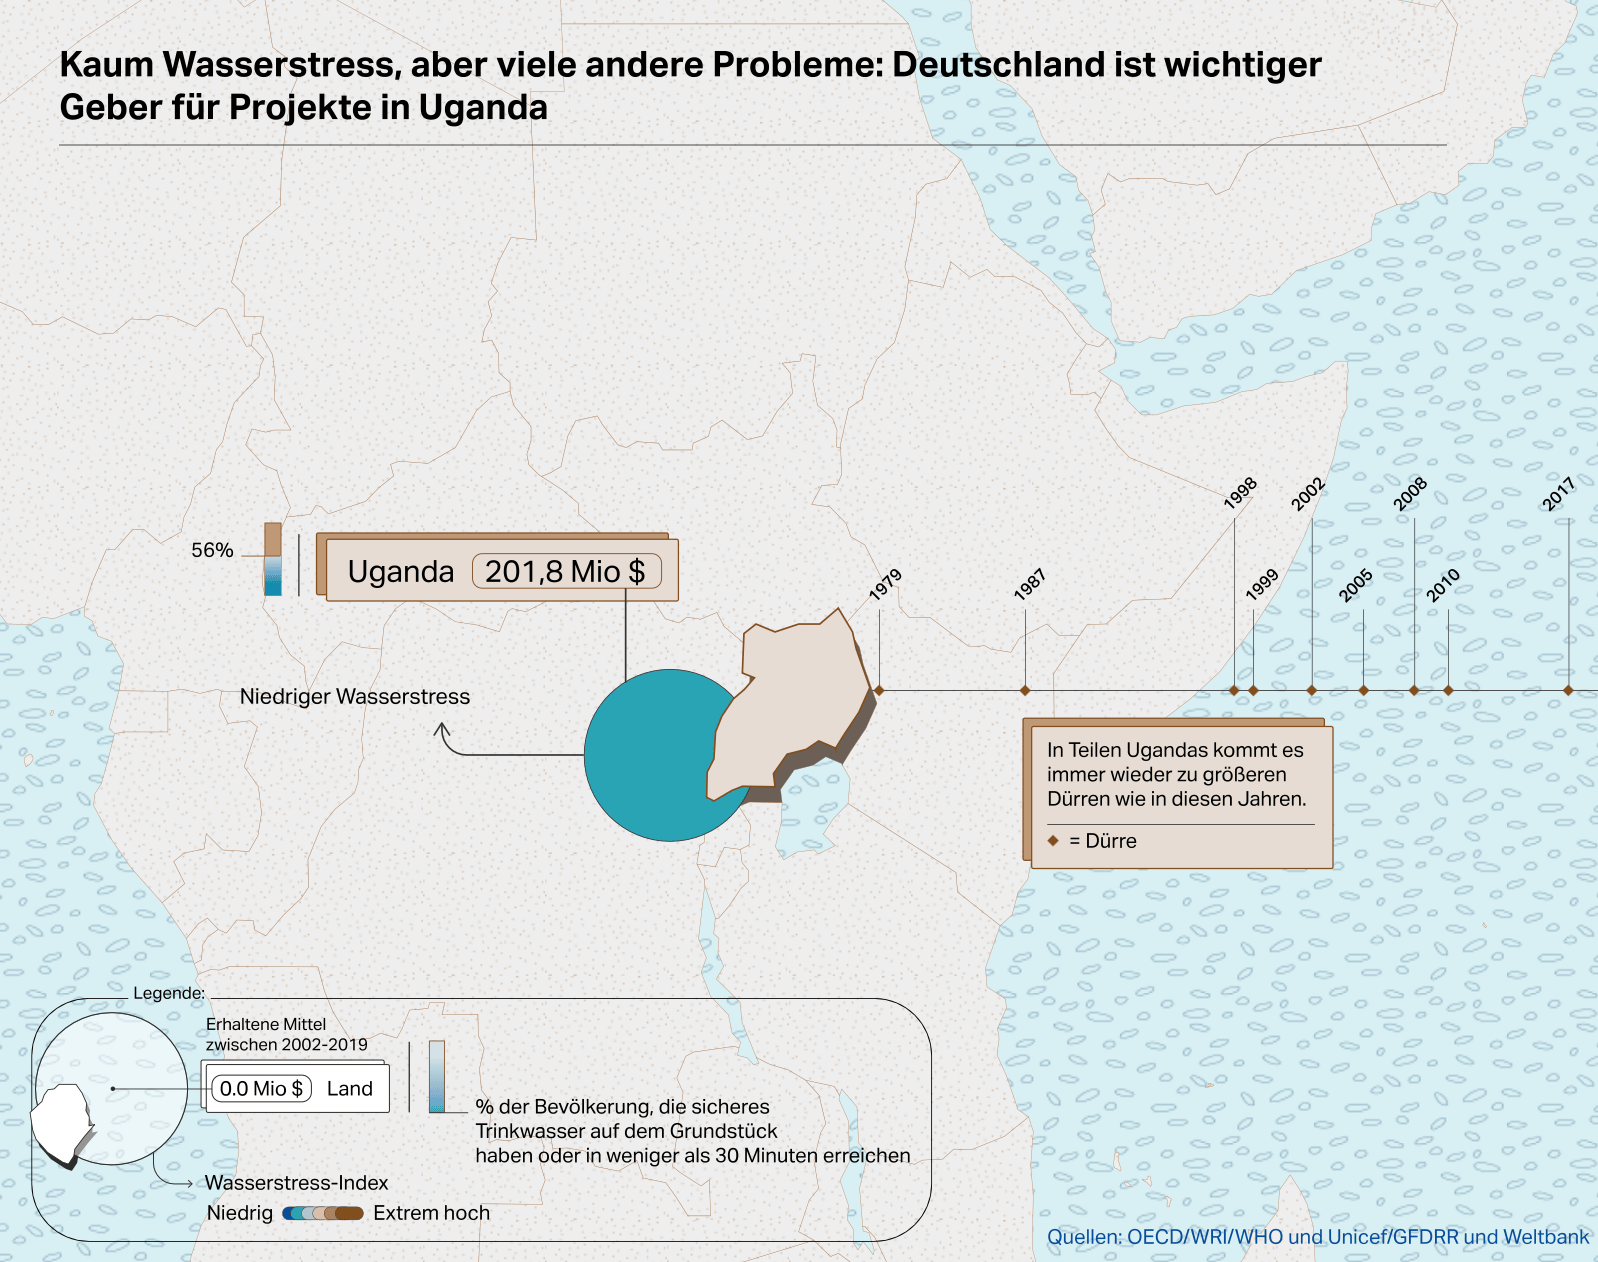
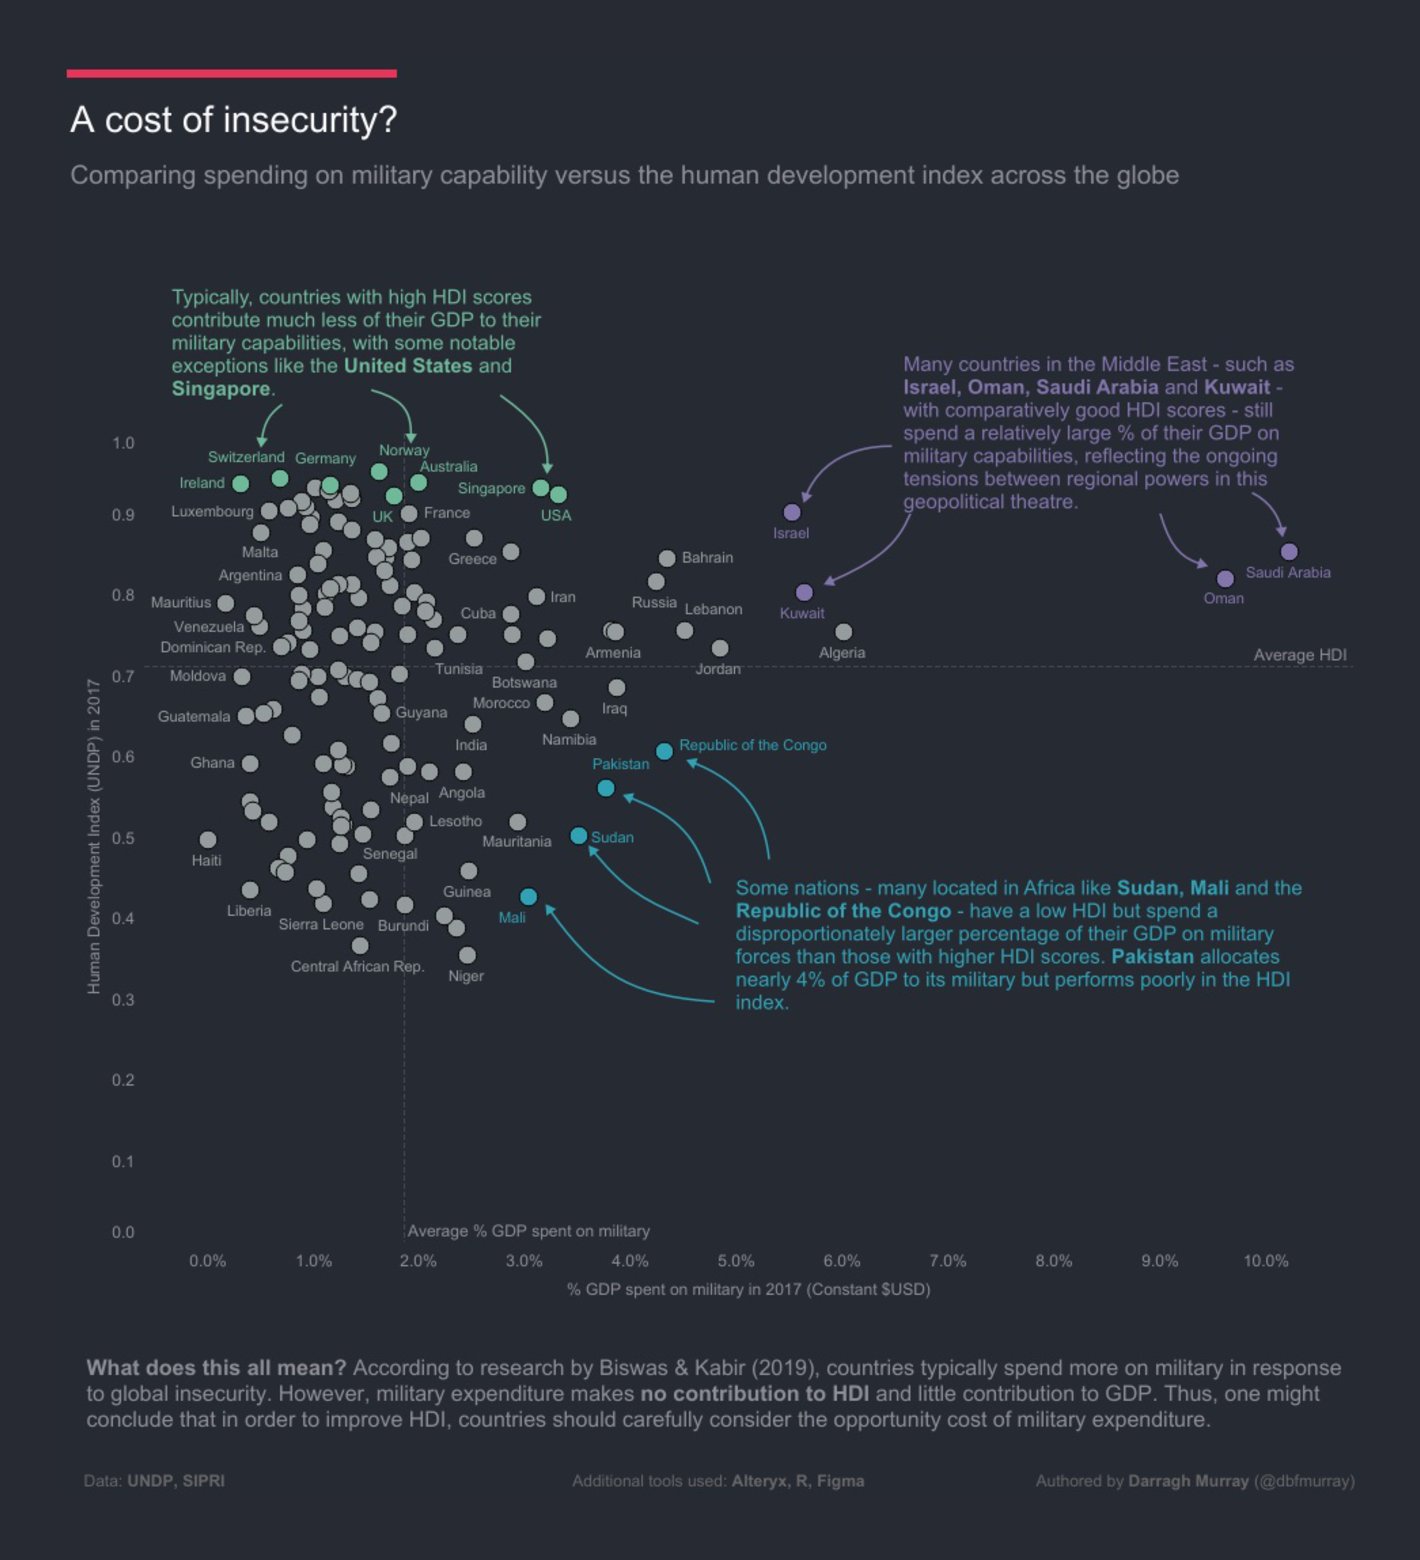
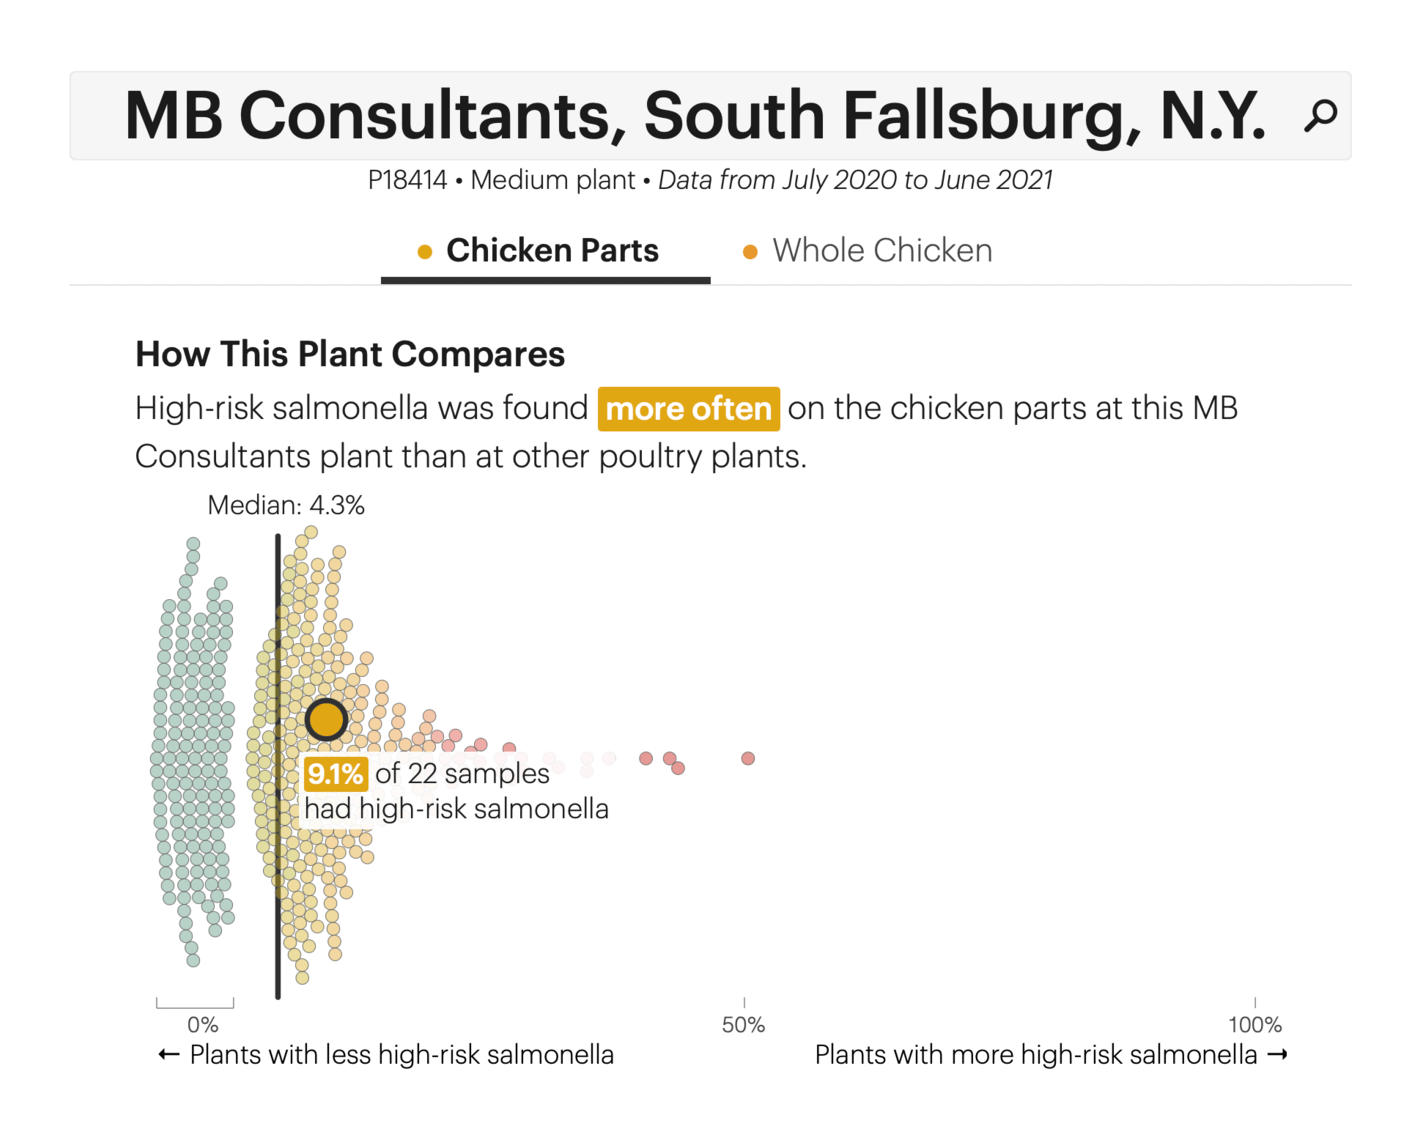
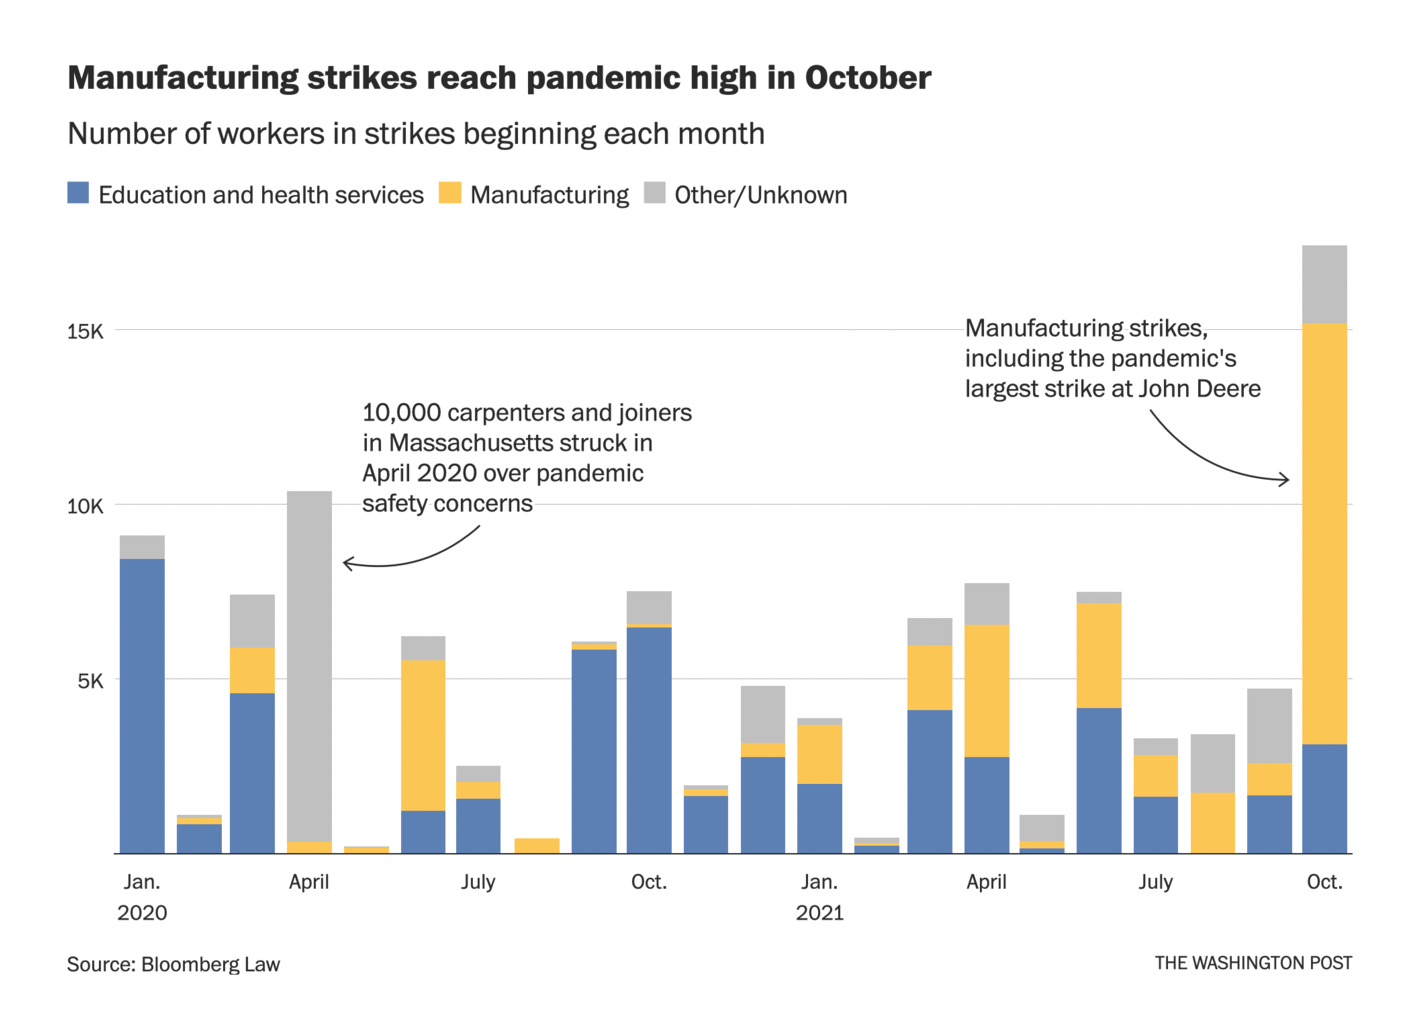
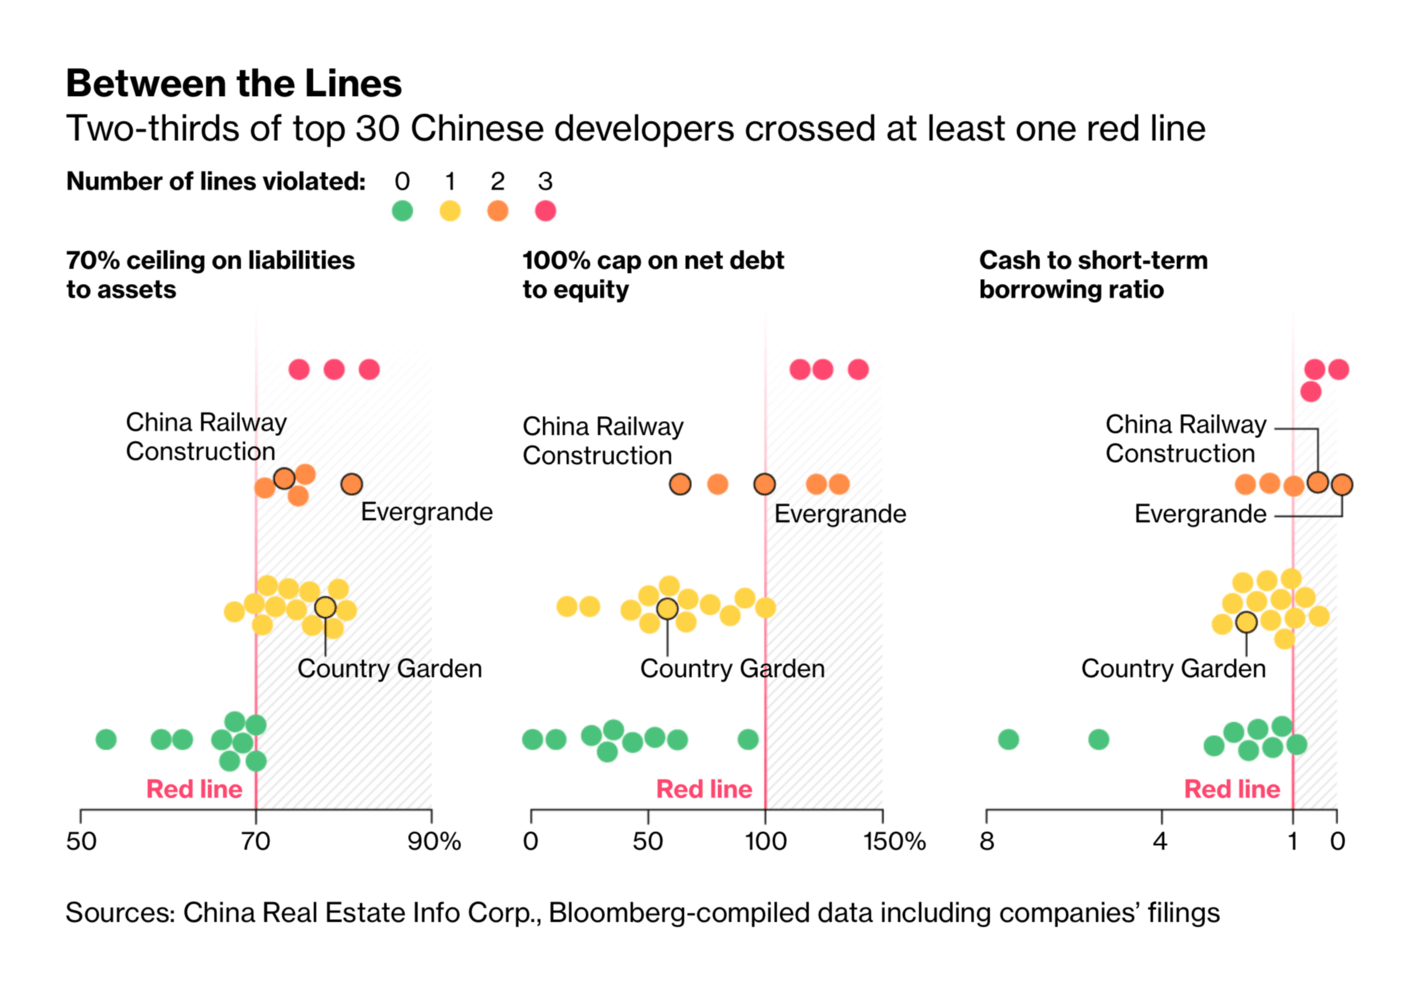
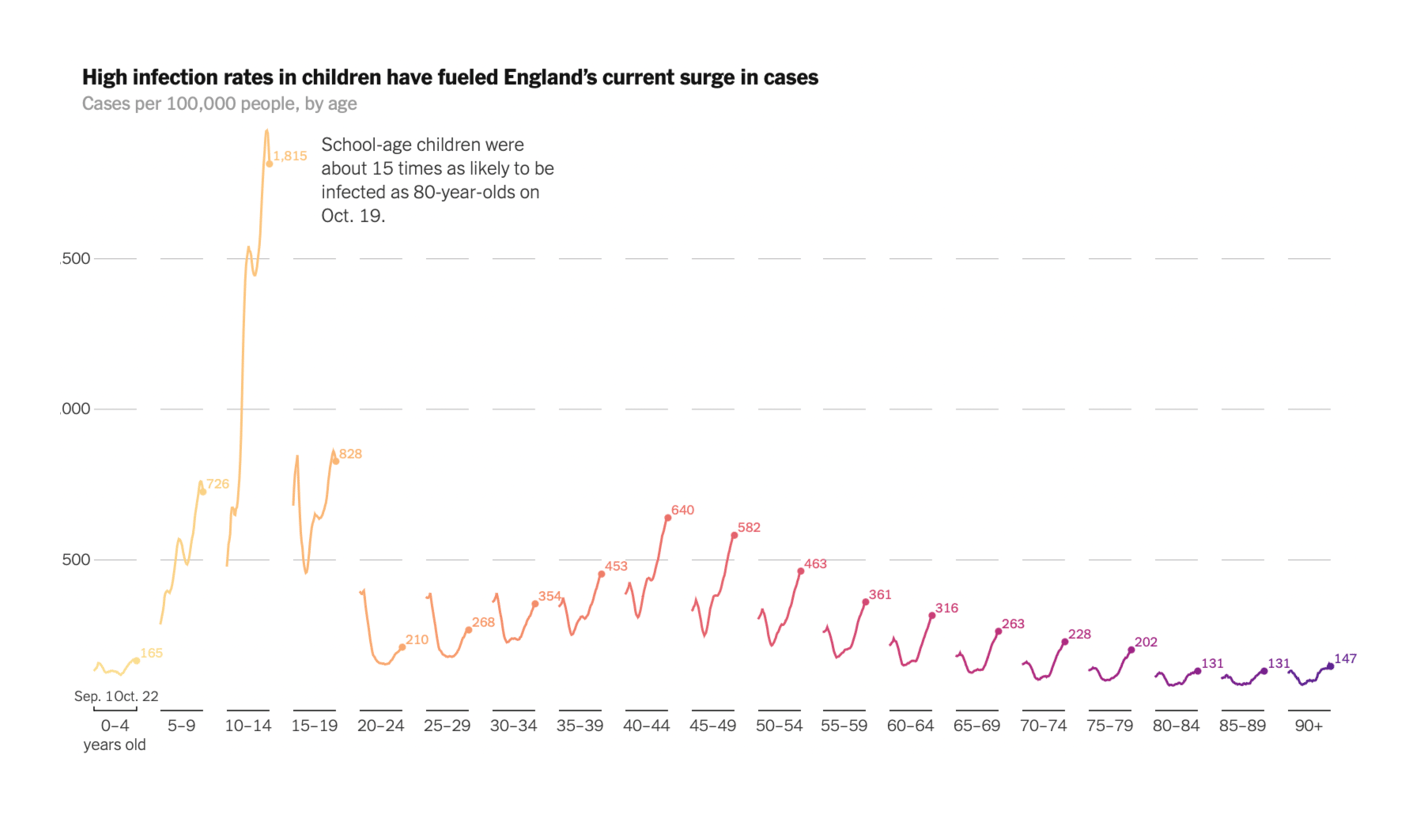
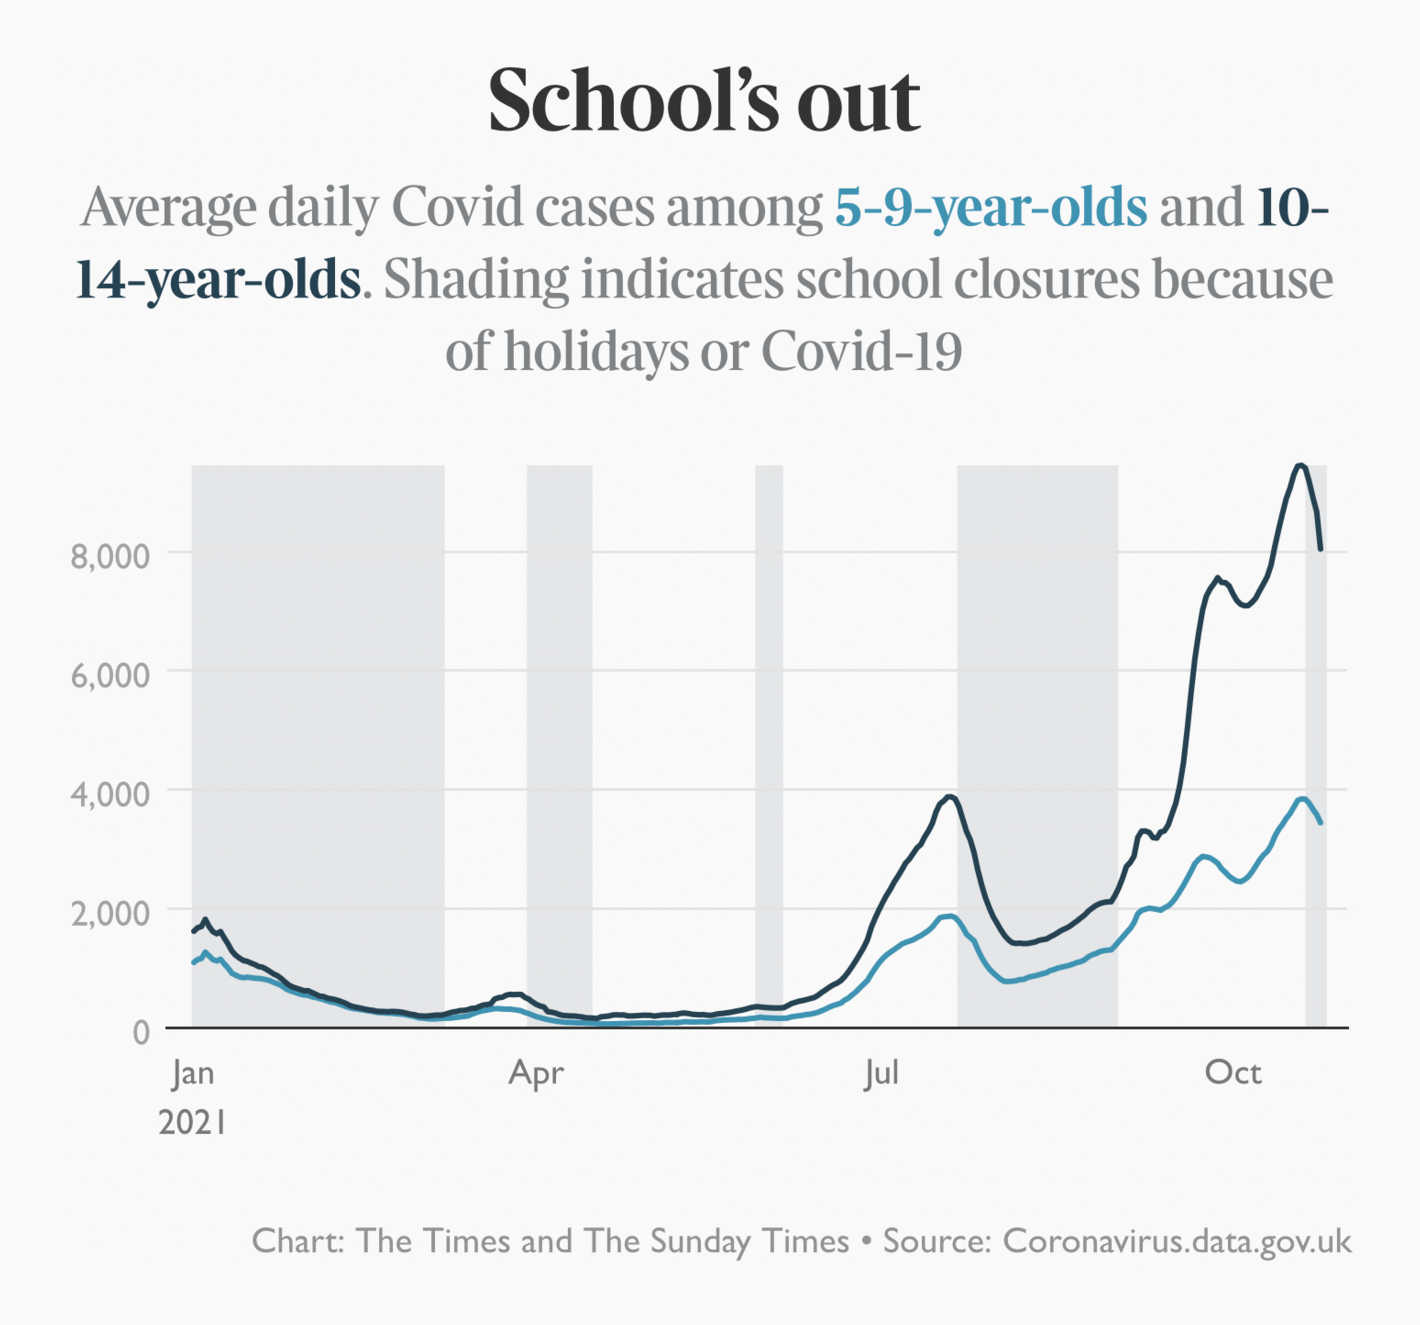
Sorry, your browser doesn't support embedded videos. CommonWealth Magazine: 最危險的海峽:共機為何轉向台灣西南角? taz: Wohin das Geld fließt Darragh Murray: "A Cost of Insecurity - comparing military spending versus the human development index," November 1 (Tweet ProPublica: Chicken Checker The Washington Post: Workplace strikes are surging. Here’s why they won’t stop anytime soon Bloomberg: Two Thirds of China’s Top Developers Breach a ‘Red Line’ on Debt Last this week, but never least, is the pandemic . The U.K. is dealing with a surge in cases among schoolchildren:
The New York Times: Children Drive Britain’s Longest-Running Covid Surge The Times: Why do the modellers always seem to get Covid infection rate wrong? We saw the latest numbers on vaccine efficacy — plus an intriguing correlation between vaccination and non-COVID mortality:
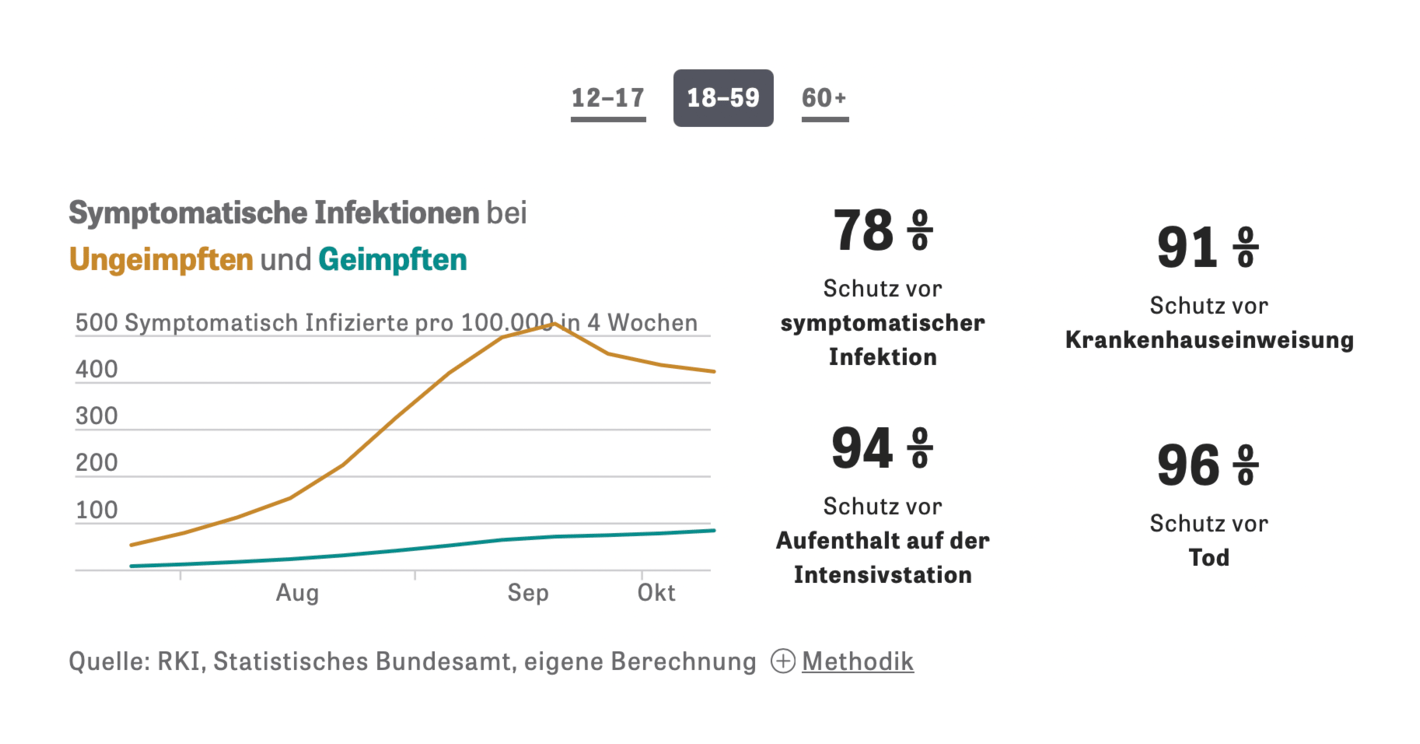
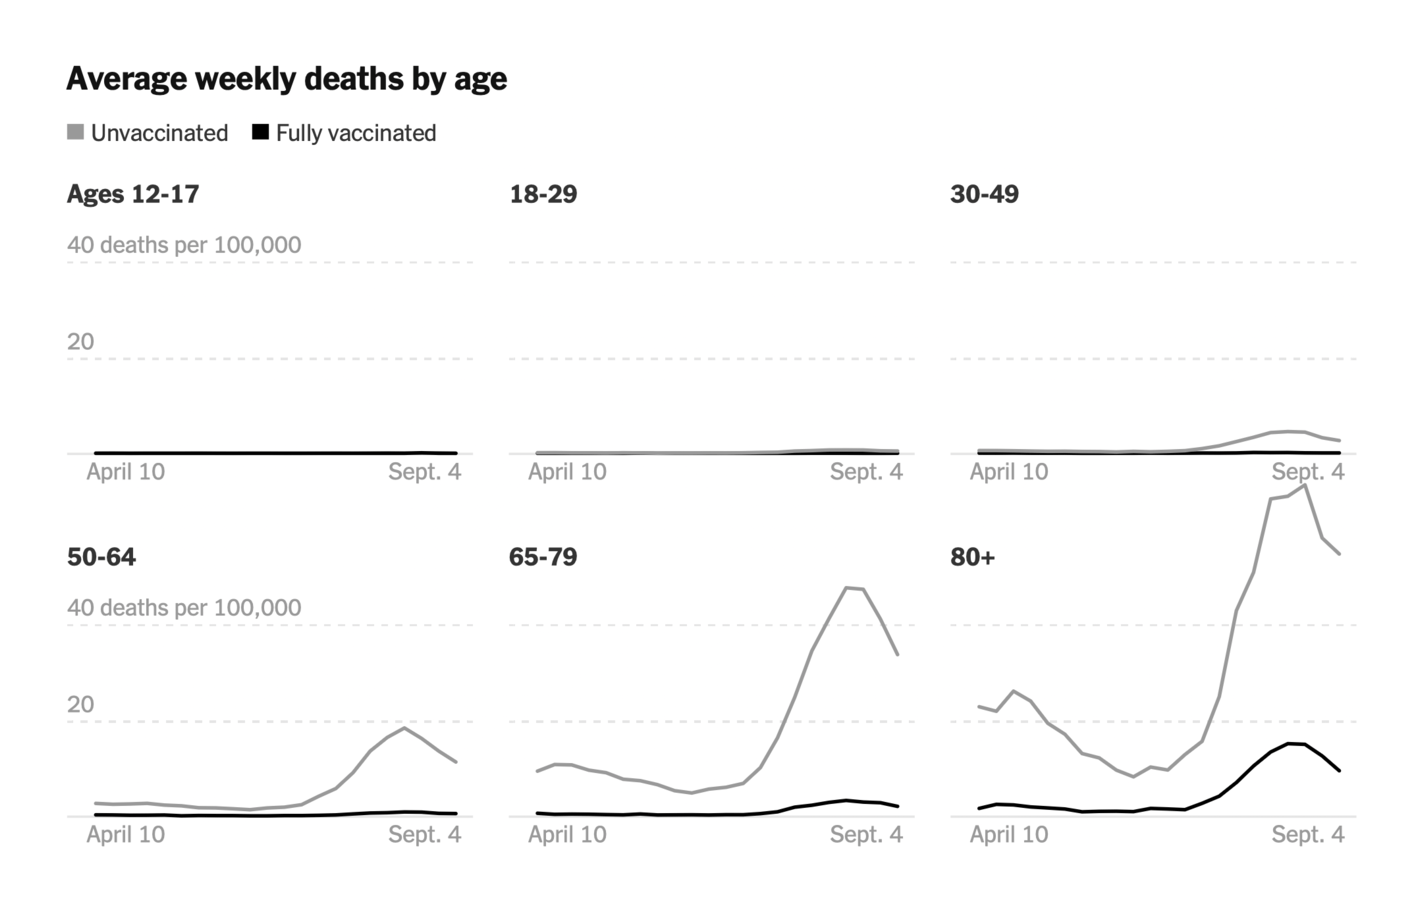
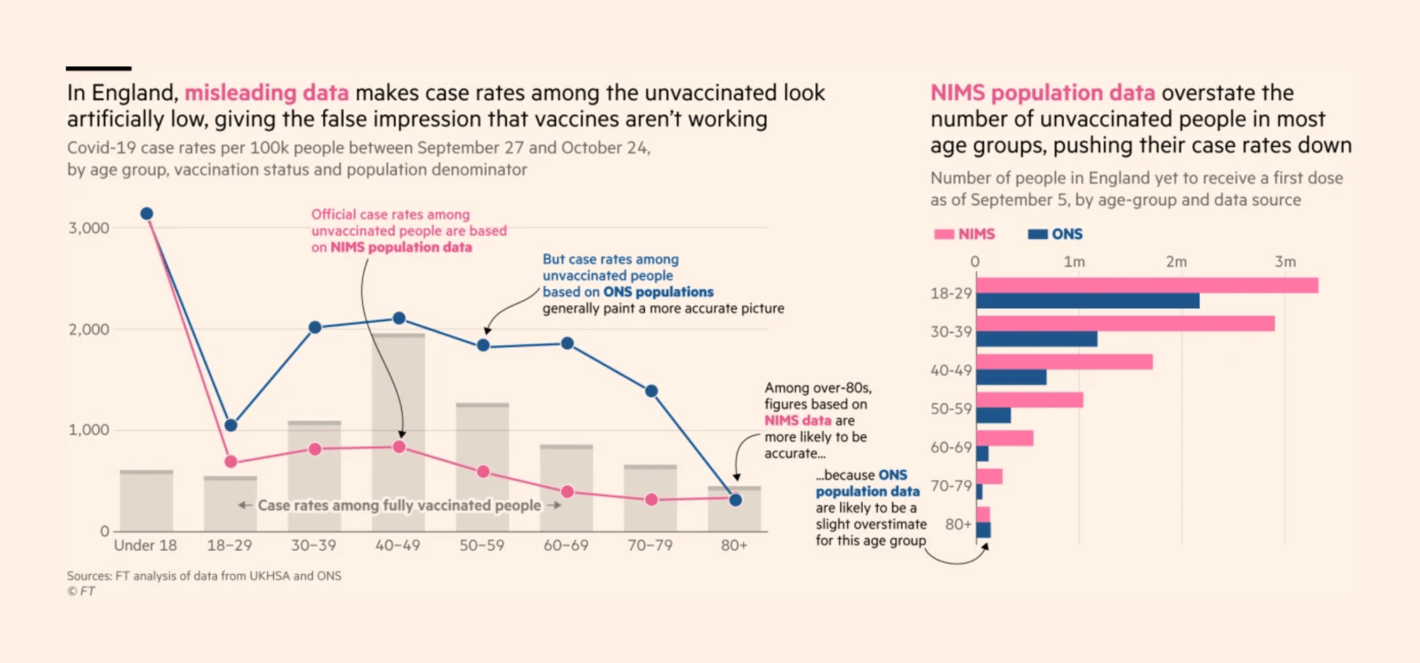
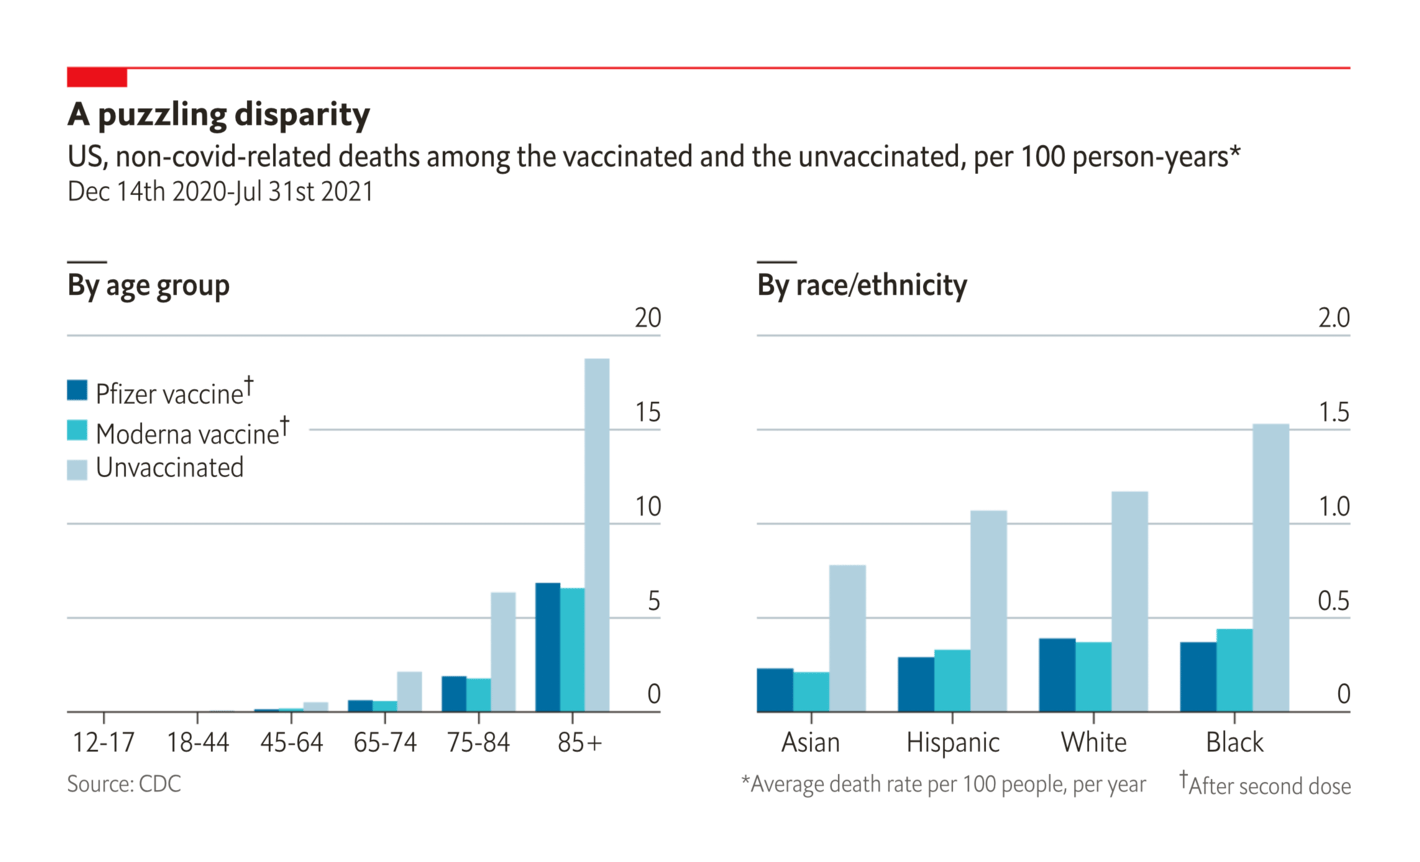
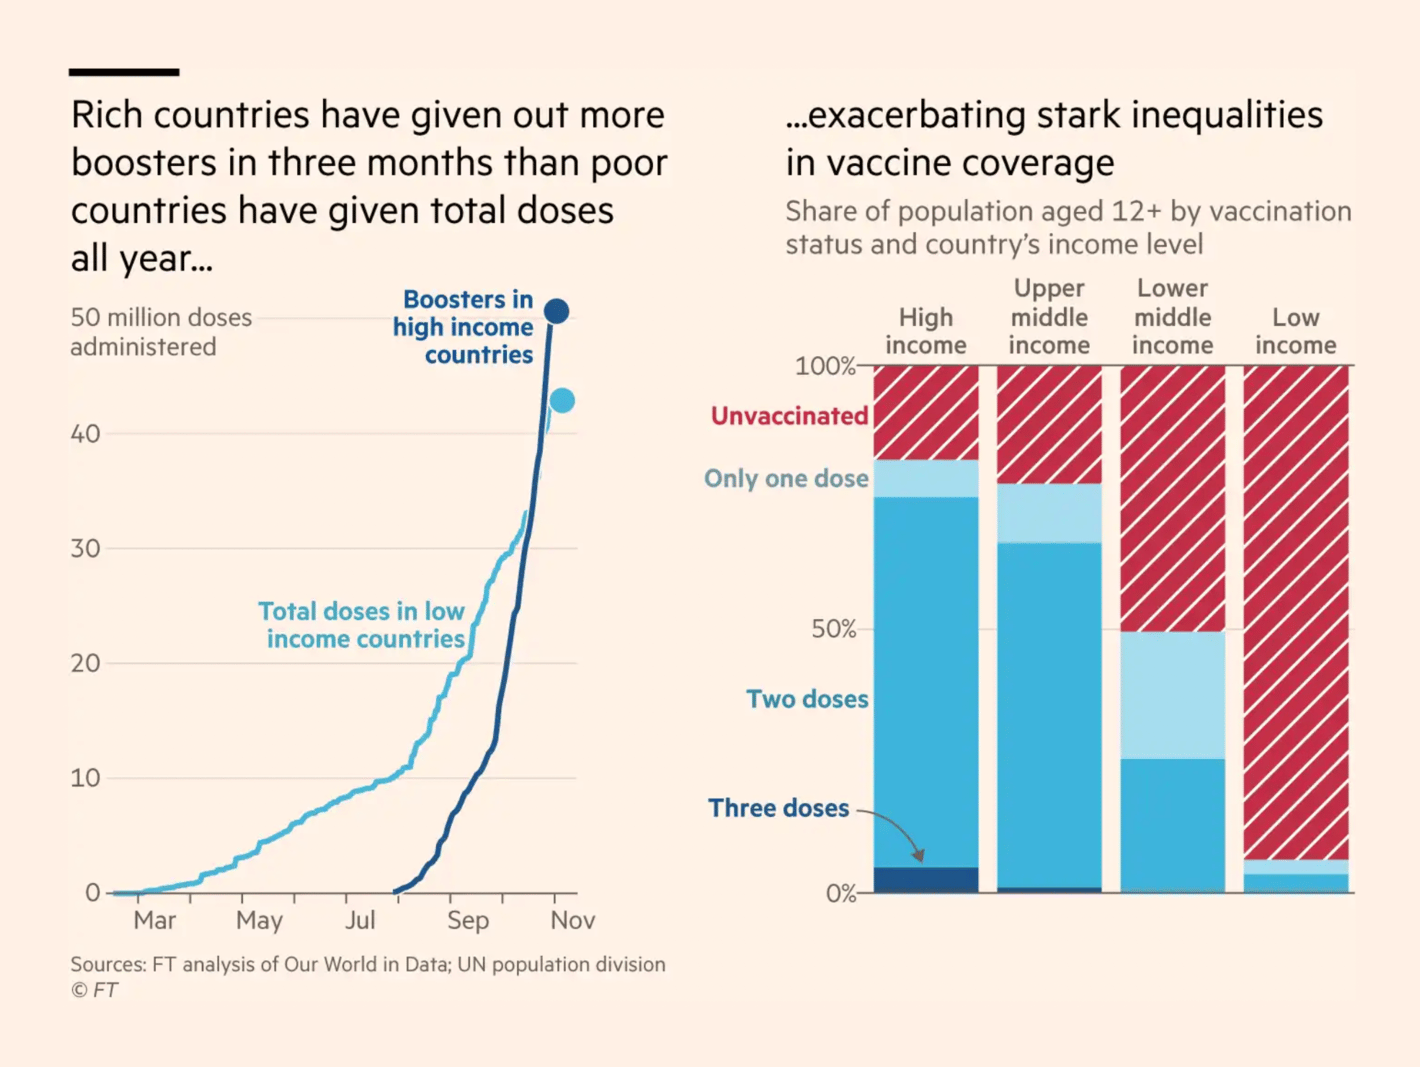
Zeit Online: Was die vierte Welle jetzt unberechenbar macht The New York Times: Who Had Covid-19 Vaccine Breakthrough Cases? Financial Times: UK statistics tsar rebukes Health Security Agency over flawed jabs data The Economist: People with covid jabs have been less likely to die of other causes Most weeks, charts on vaccine distribution wouldn't go in our section on the social-economic dimension of the pandemic . But this week, the distinction got pretty blurred:
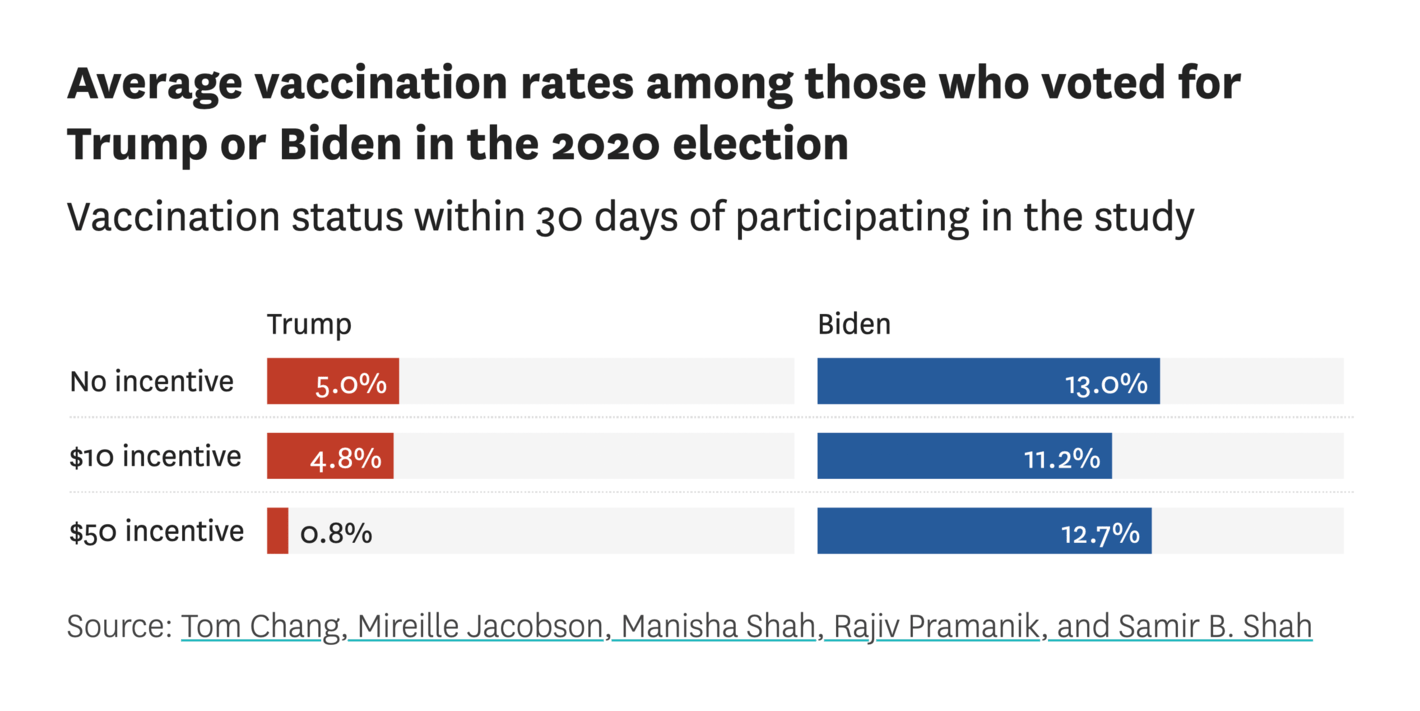
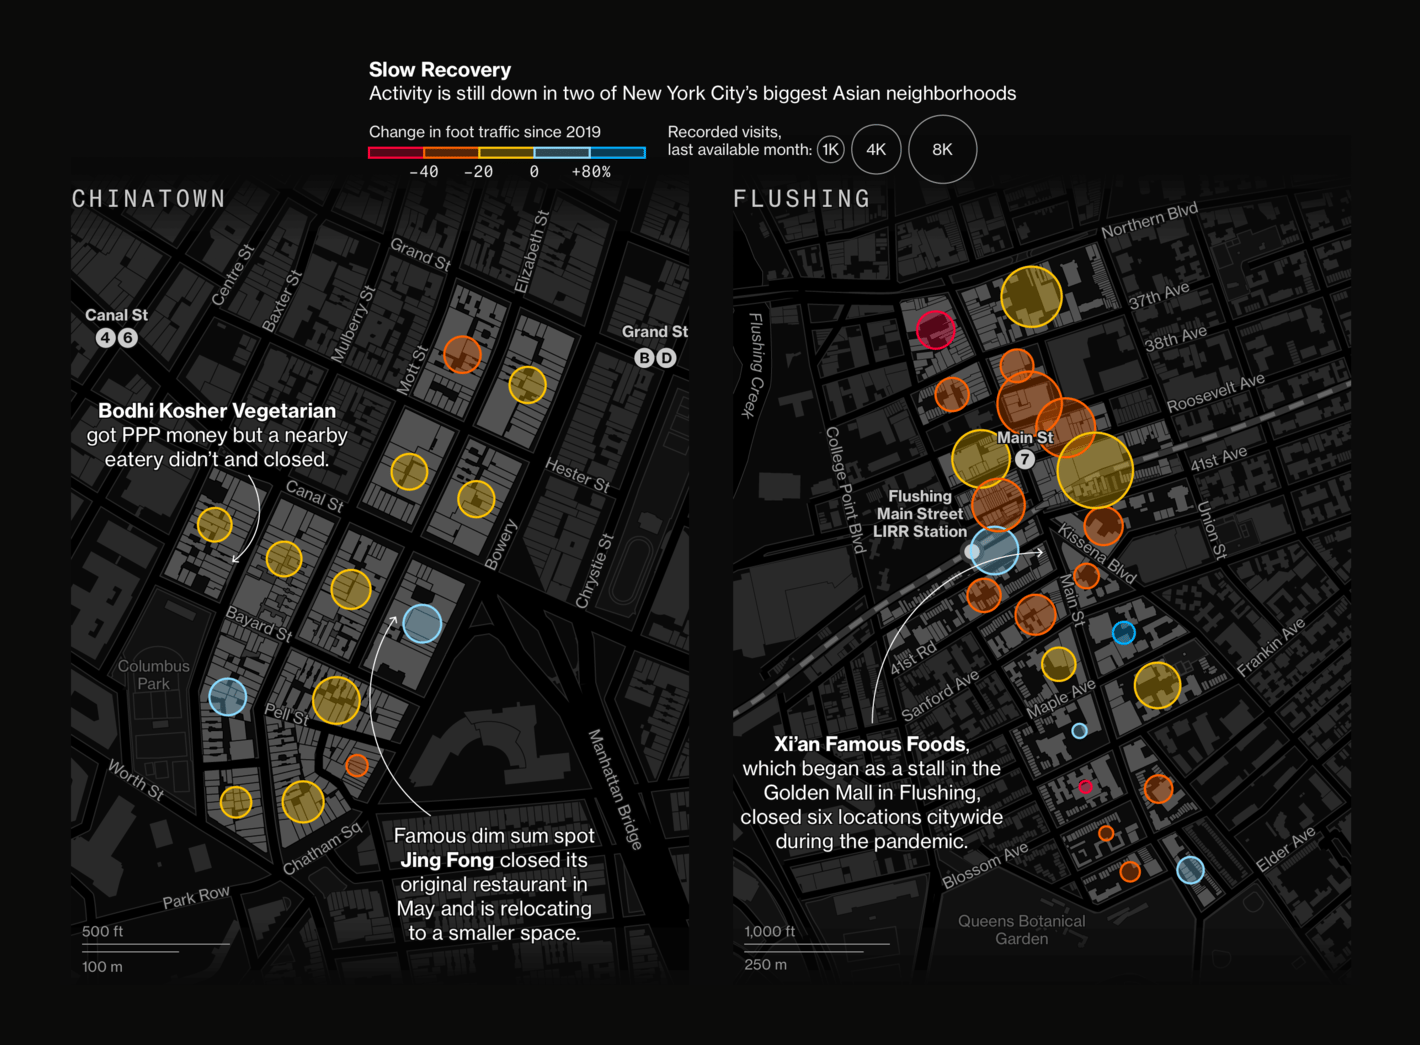
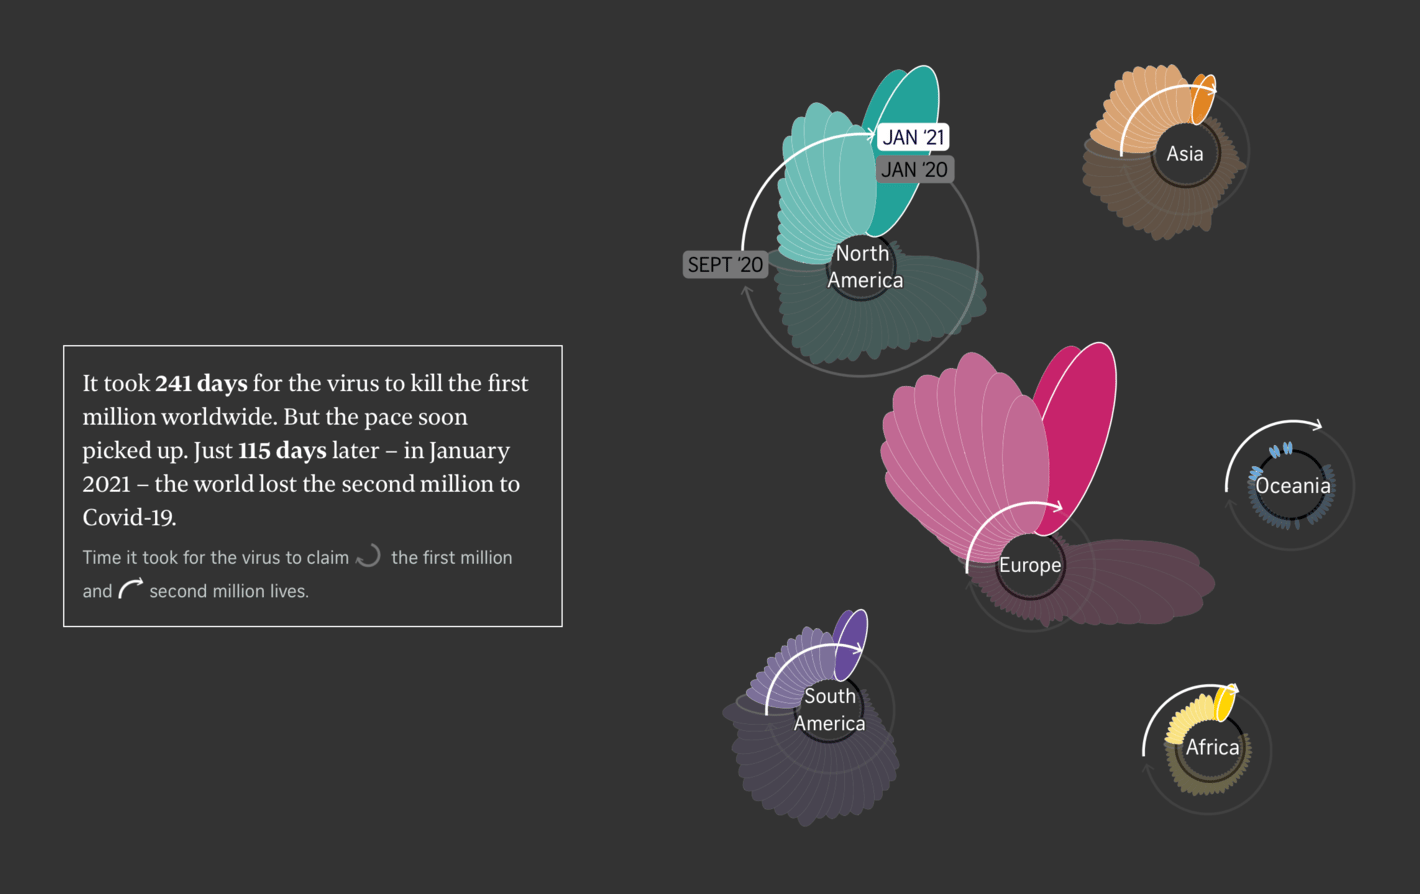
Financial Times: Global Covid-19 death toll tops 5m but underestimates true figure, say experts The San Francisco Chronicle: Should the vaccine hesitant be paid to get vaccinated? A Bay Area study shows it probably doesn't work Bloomberg: New York’s Once-Thriving Asian Businesses Struggle to Recover From 4,000% Unemployment Spike Finally, these flowers offered a painful look back at the global death toll so far:
The Straits Times: Remembering the 5 million lives lost to Covid-19