Join our webinar to learn more about Datawrapper maps

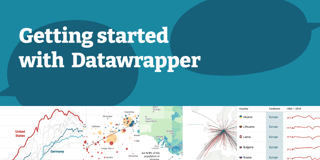
Are you already familiar with Datawrapper and interested in exploring its advanced features for creating maps? Our mapping webinar is for you!
Join me to learn about advanced mapping with Datawrapper on .
That’s 8 a.m. on the U.S. West Coast; 11 a.m. on the East Coast; 12 noon in Brazil and Argentina; 4 p.m. for readers in the U.K. and West Africa; 5 p.m. for most Europeans; and 8:30 p.m. in India. (All time zones in between are welcome too, of course!)
We'll discuss the types of maps you can create with Datawrapper and learn advanced skills like uploading a custom basemap and customizing tooltips with HTML. You'll have a chance to try your hand at some of those in real time. And I'll point you towards resources for learning even more about Datawrapper maps on your own.
If you have any more questions, write them in the comments here or send them to guillermina@datawrapper.de. If you can't make it this time, don't worry — there will be more intro sessions to come as well. You can follow Datawrapper on Twitter or subscribe to our Blog Update newsletter to hear about future webinars. I'm looking forward to diving deeper into Datawrapper maps together!


