Bar chart
Create beautiful bar charts in Datawrapper
Go through just a few settings to build the bar chart that works best for your data
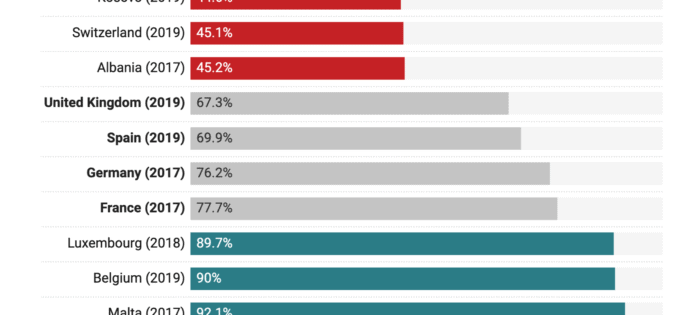
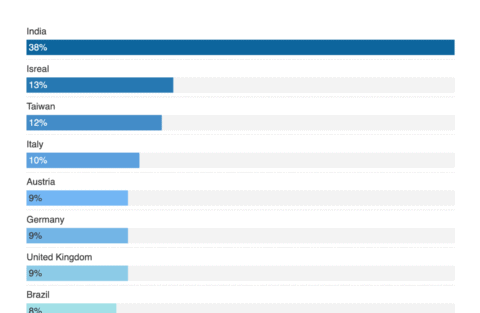
In Datawrapper, you can color your bars by category – like industry or continent. You can also color each bar individually. Then, simply turn on a color key and adjust its labels to make clear what your colors indicate.

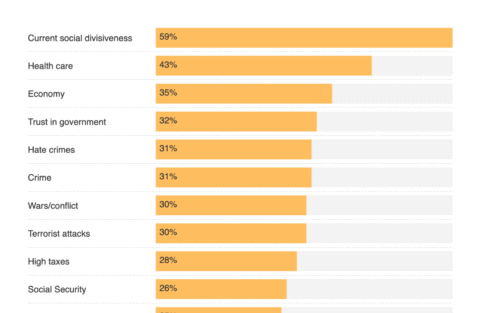
As soon as you upload your data, you will see a beautiful bar chart – but every data set is different, and we want to help you communicate it best.
You need to move the labels to a separate line? Or sort your bars differently? Or align the values on the right instead of on the left? Just click around until you’re happy with the result.
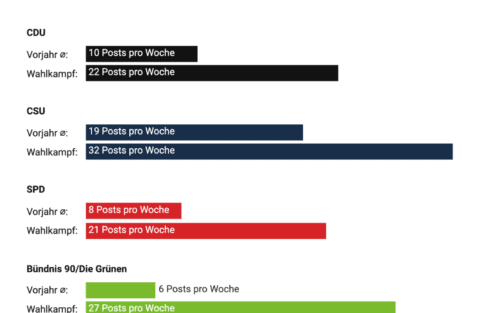
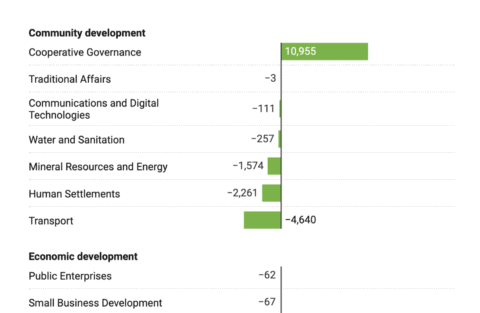
Besides coloring your bars differently, you can also bring a sense of order into your bars by grouping them – for example, by location or rating. Simply add a column with a different category, then click “Group by”.


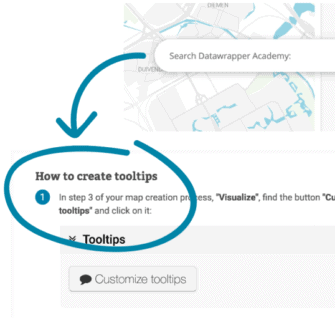
Need help creating Datawrapper charts?
We’re here for you.