
Case studies
How Datawrapper keeps 20 years of charts looking beautiful, consistent, and up-to-date.
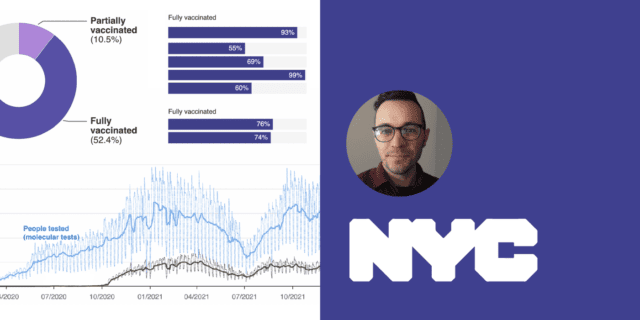
How Datawrapper is helping a big public health department to meet the challenges of the pandemic.
How Datawrapper went from one person’s discovery to an organization’s tool of choice

Ten languages, five scripts, two data journalists — one charting tool

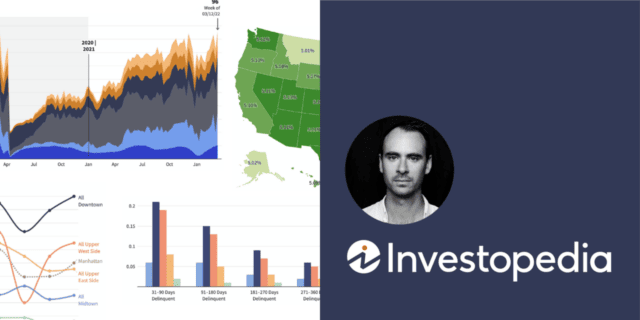
How Mike Brondbjerg, a “design team of one,” uses Datawrapper to improve his workflow

How one graphics editor, and his newspaper, went digital-first and stayed “in the game” with Datawrapper’s quick, interactive, mobile-friendly charts
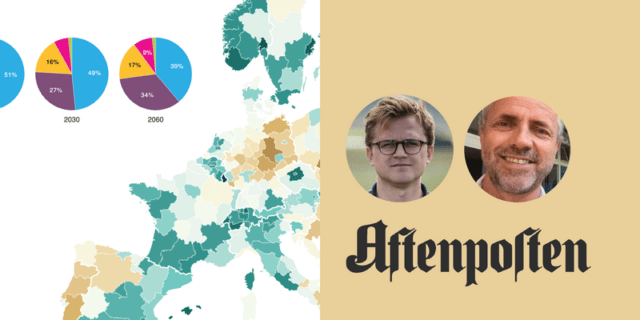
How Datawrapper helped in Aftenposten’s transition from a print newspaper to “digital-first”
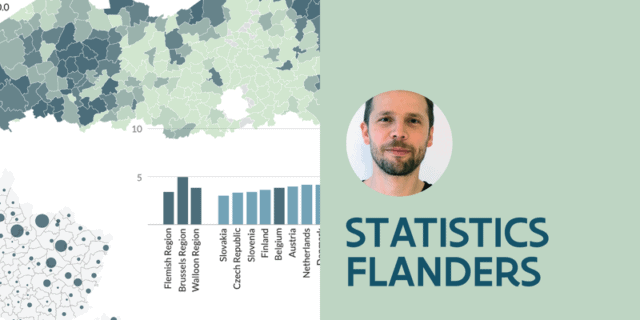
How Statistics Flanders in Belgium makes statistics a public good with Datawrapper
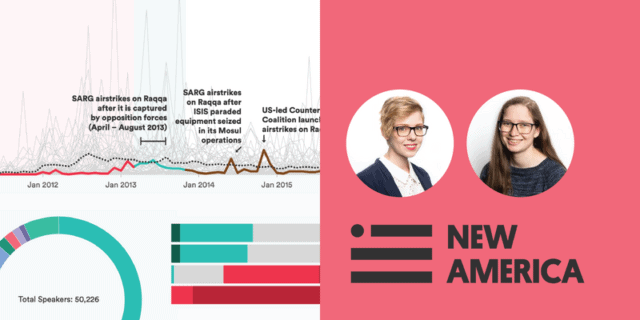
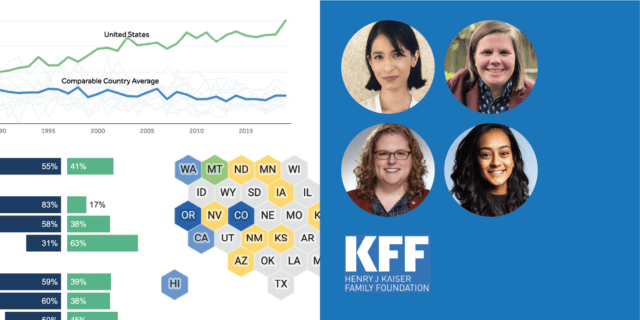
How and why the US-American think tank switched from an in-house charting tool to Datawrapper

How Adam Marton, a journalism professor, used Datawrapper to help students from the Philip Merrill College of Journalism learn data visualization
